
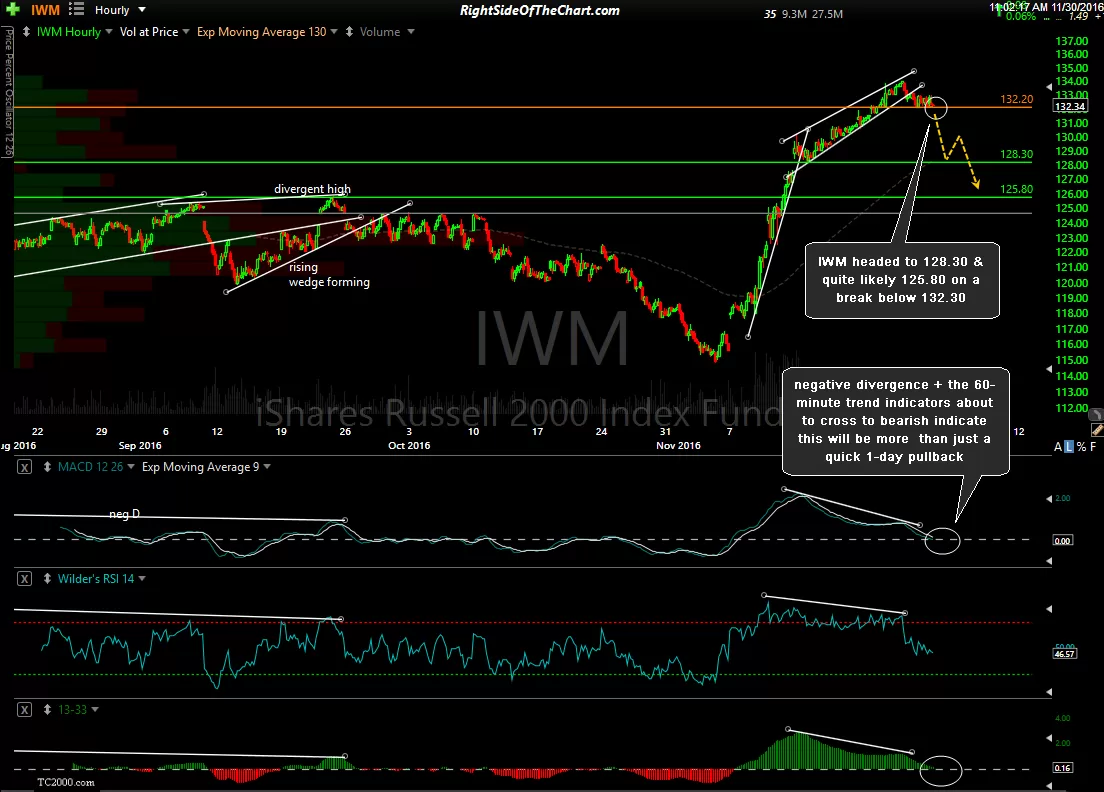
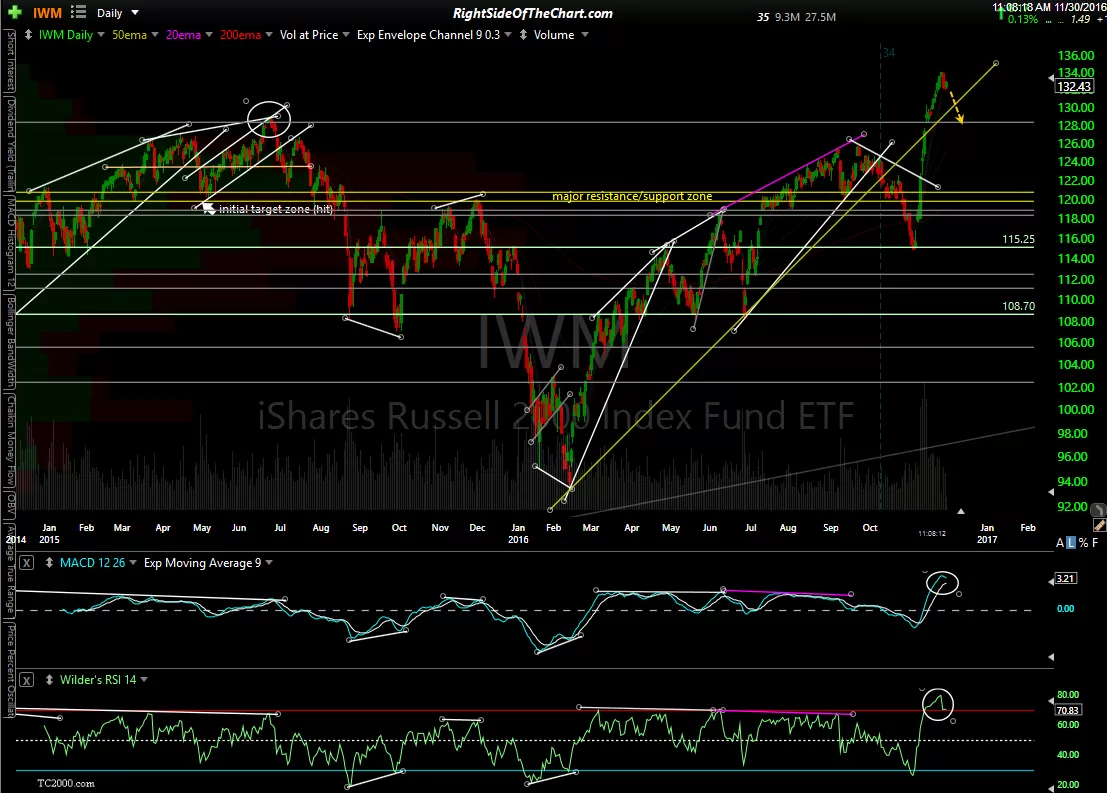
IWM (Russell 2000 Index Tracking ETF) looks to be headed to 128.30 & quite likely 125.80 on a break below 132.30. On the 60-minute chart, negative divergence as well as the 60-minute trend indicators about to cross to bearish indicate this will be more than just a quick 1-day pullback while the extreme overbought readings on the MACD & RSI on the daily time frame, both of which appear to have peaked & have now turned down, also indicate the likelihood of that these price targets* will be hit in the coming days to weeks.
-
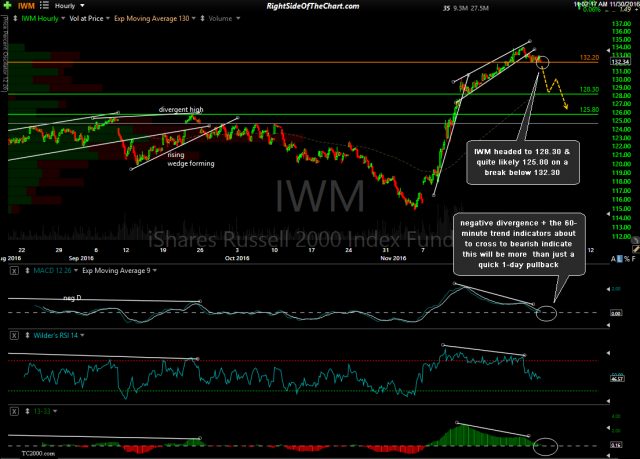
- IWM 60-minute Nov 30th
-
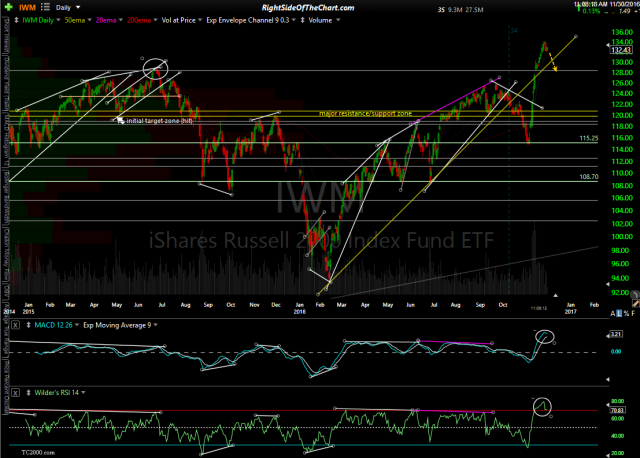
- IWM daily Nov 30th
*128.30 & 125.80 are the actual support levels. As this is only an unofficial trade idea at this time, those pullback targets have not been adjusted for an optimal fill. If shorting IWM or any related instrument, best to set your BTC limit orders slightly above those level to help assure a fill, should IWM reverse just shy of the actually support level.