
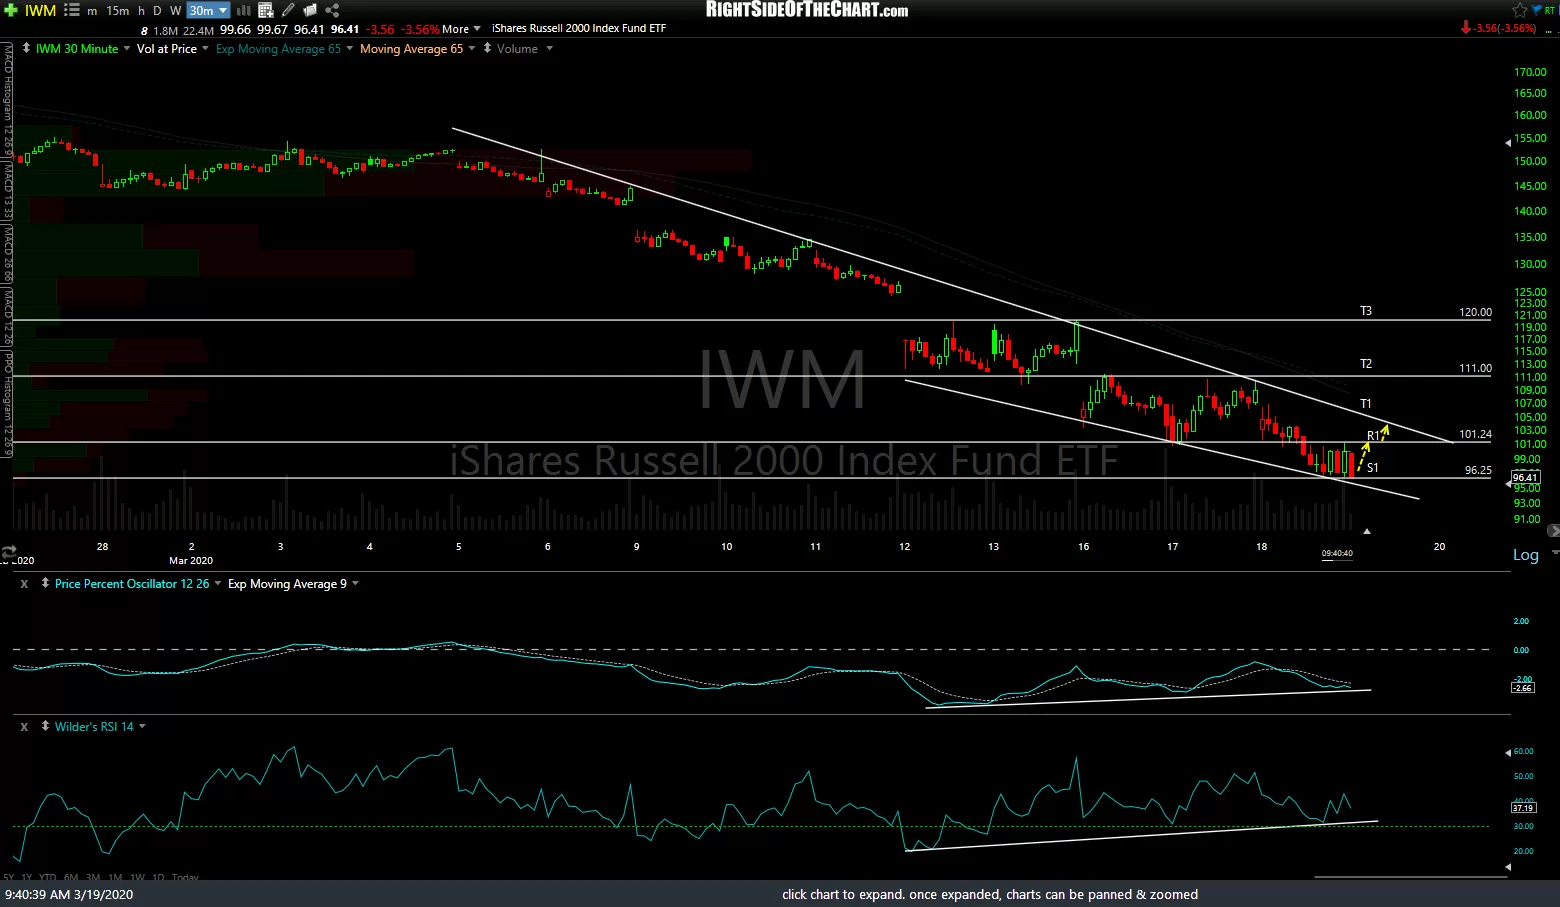
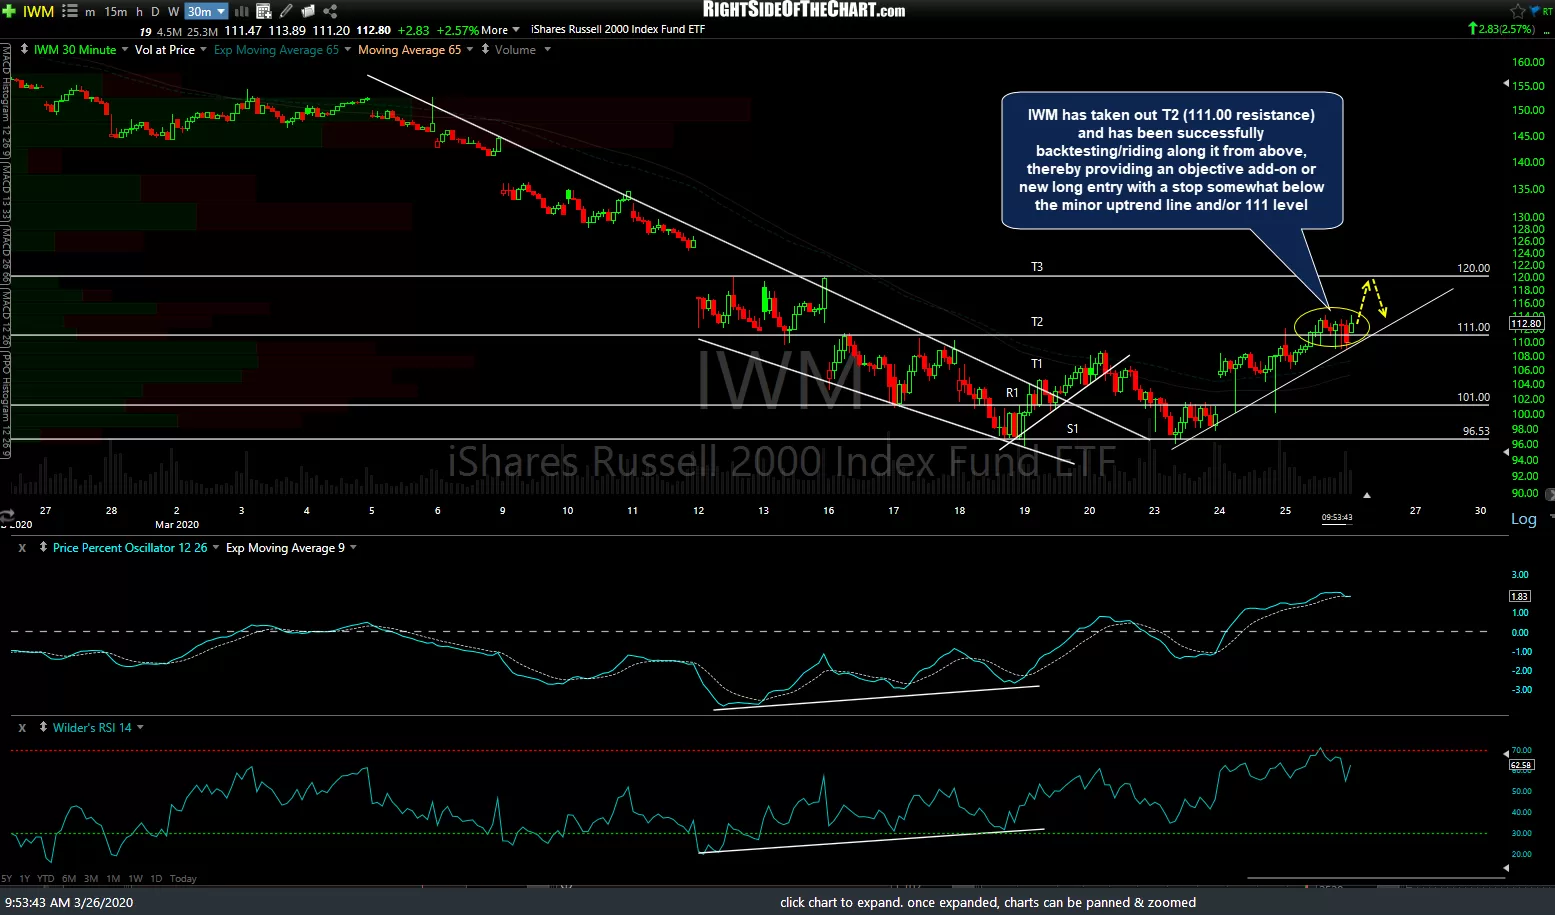
IWM has taken out T2 (111.00 resistance) and has been successfully backtesting/riding along it from above, thereby providing an objective add-on or new long entry with a stop somewhat below the minor uptrend line and/or 111 level. Previous 30-minute chart from March 19th (first highlighting the price targets) followed by the updated 30-minute chart below.
-
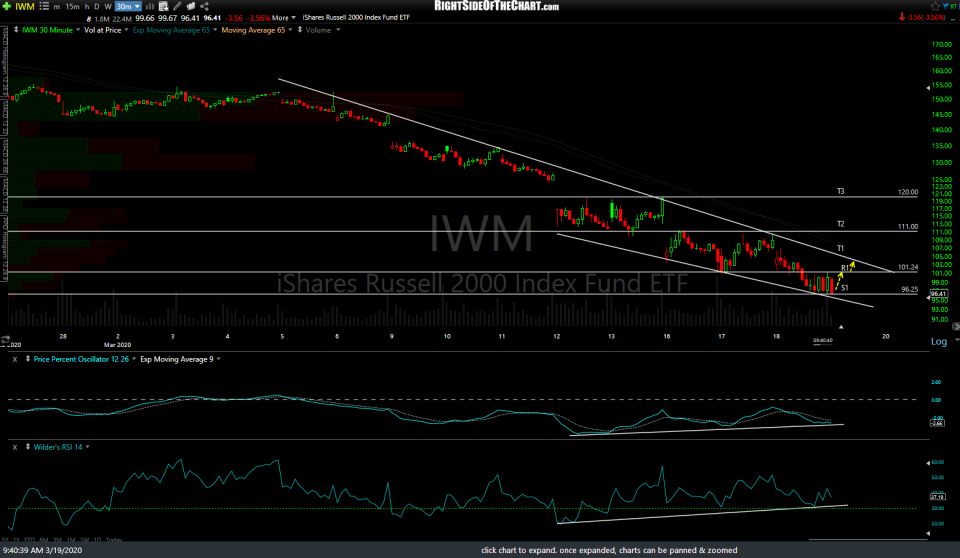
- IWM 30m March 19th
-
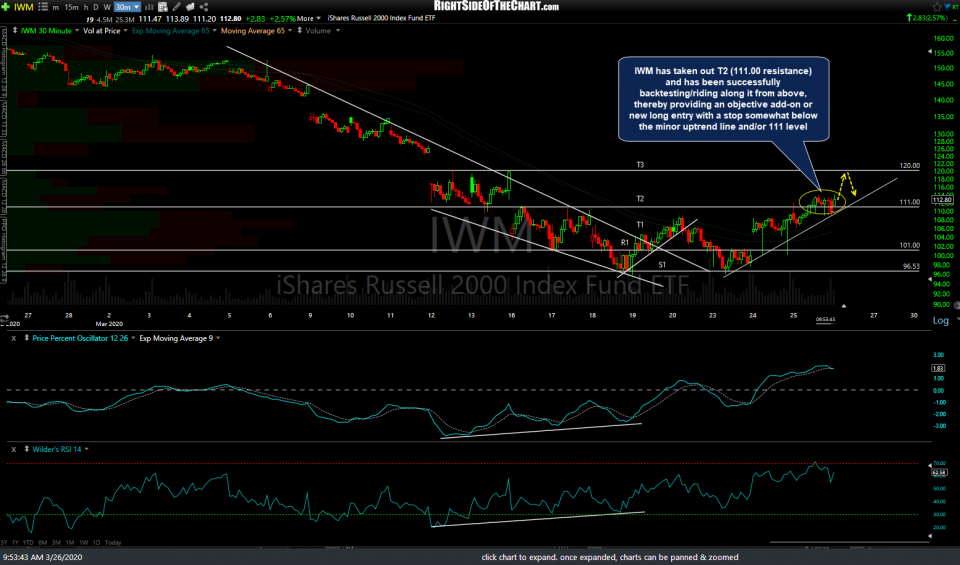
- IWM 30m March 26th
IWM is still just an unofficial trade although I figured an update was in order as I suspect the small-caps will likely outperform the large-caps, should this recent rally have some more room to run.