
The undisputed king of the semiconductor sector, INTC (Intel Corp) may or may not tread sideways until the company reports earnings on Jan 23rd but either way, the stock appears poised for at least a 10% drop from current levels & quite possibly much more in the coming months. I’m contemplating adding INTC as an Active Short Trade before earnings although shorting the largest semiconductor stock trading near all-time highs while in an unmistakable bullish trend by nearly all metrics would be a very aggressive counter-trend trade running an increased chance of the trade being stopped out for a loss.
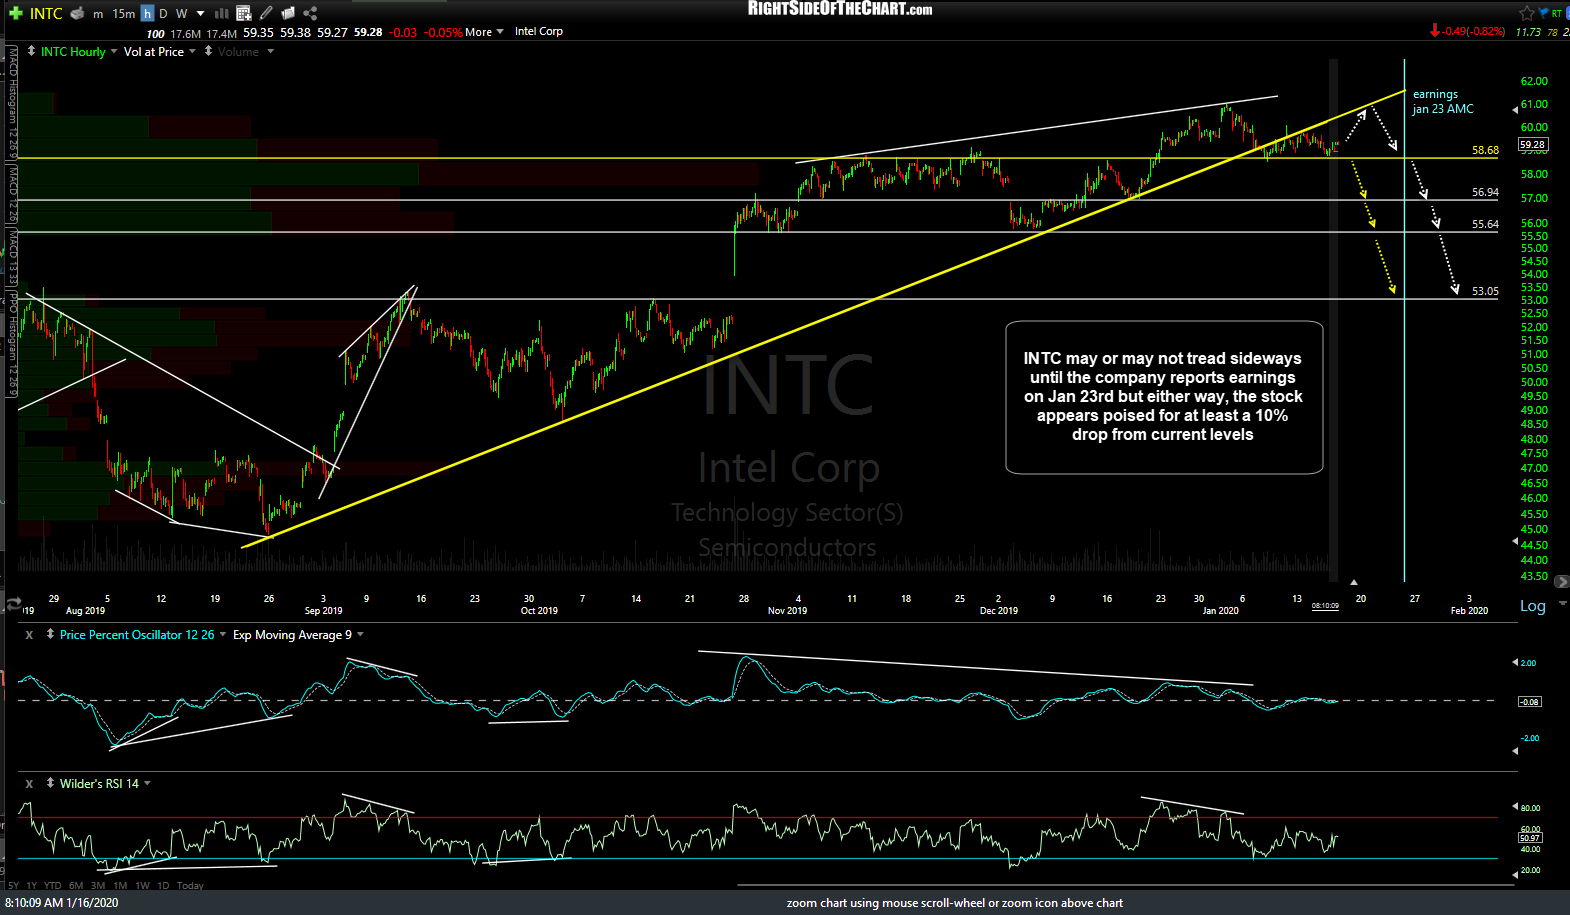
INTC 60m Jan 15th close
With that being said, I’m passing Intel along as a Trade Setup for now with an official entry trigger TBD. For those that might want to take a partial or even full position in advance of earnings, be advised that INTC reports earnings on Thursday, Jan 23rd after the market close which will almost certainly cause the stock to gap one way or the other at the market open on Friday, January 24th. Quite often, stocks will go into a holding pattern in the weeks & days leading up to their quarterly earnings report so barring a big move in the major stock indices before then, INTC is likely to grind around for the next week or so. Even a break below the 58.68ish support level, which would be the short entry trigger, runs an increased chance of proving to be a whipsaw signal due to the upcoming earnings report.
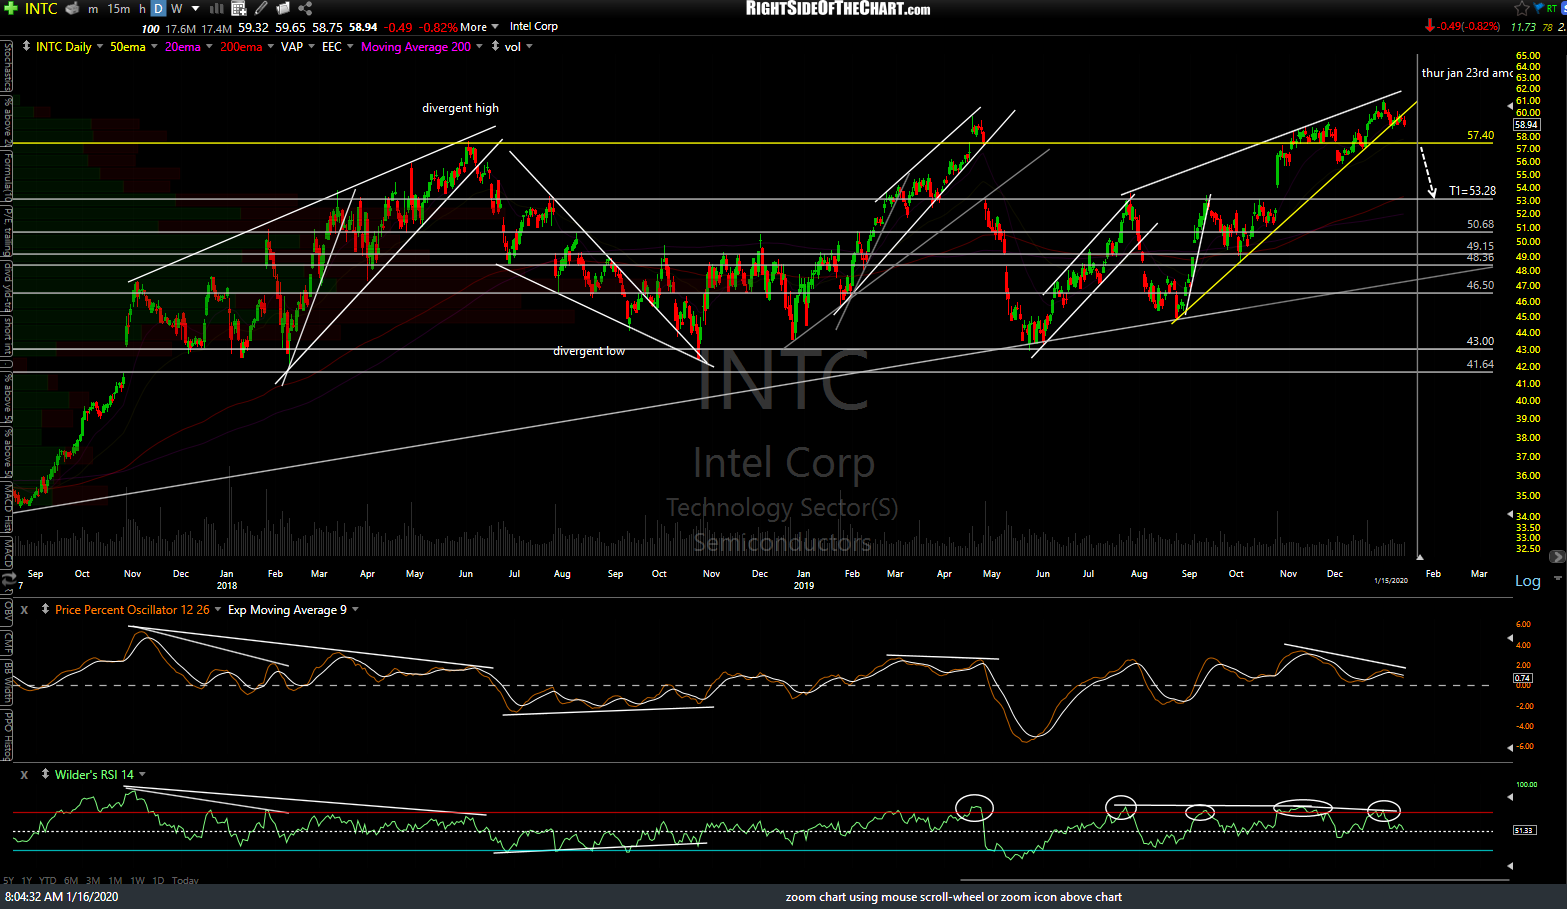
INTC daily Jan 15th close
INTC recently broke down below the bearish rising wedge pattern shown on the 60-minute chart above although not impulsively plus, the stock held the 58.68 support level just below the uptrend line. That rising wedge pattern can also be viewed on the daily chart below, along with a potential swing target although the 60-minute chart lists some additional, unadjusted price targets (actual support levels) that active traders might use to micro-manage a short trade (or buy-the-dip levels for those longer-term bullish on the stock).
Zooming out to the longer-term weekly chart below, INTC appears to be in what may prove to be the final stages of a large triple-top pattern with 3 roughly equal peaks around the 58ish area. As with the previous two major peaks from June 2018 & April 2019, both of which were followed by sharp drops of 26% & 28%, the stock currently has negative divergences. In fact, the same divergences that were in place at the first peak back in mid-2018 are still intact & have only grown much larger since then, indicating a potentially much larger drop (bear market), if & when those divergences are still intact should we get a solid sell signal on the weekly time frame.
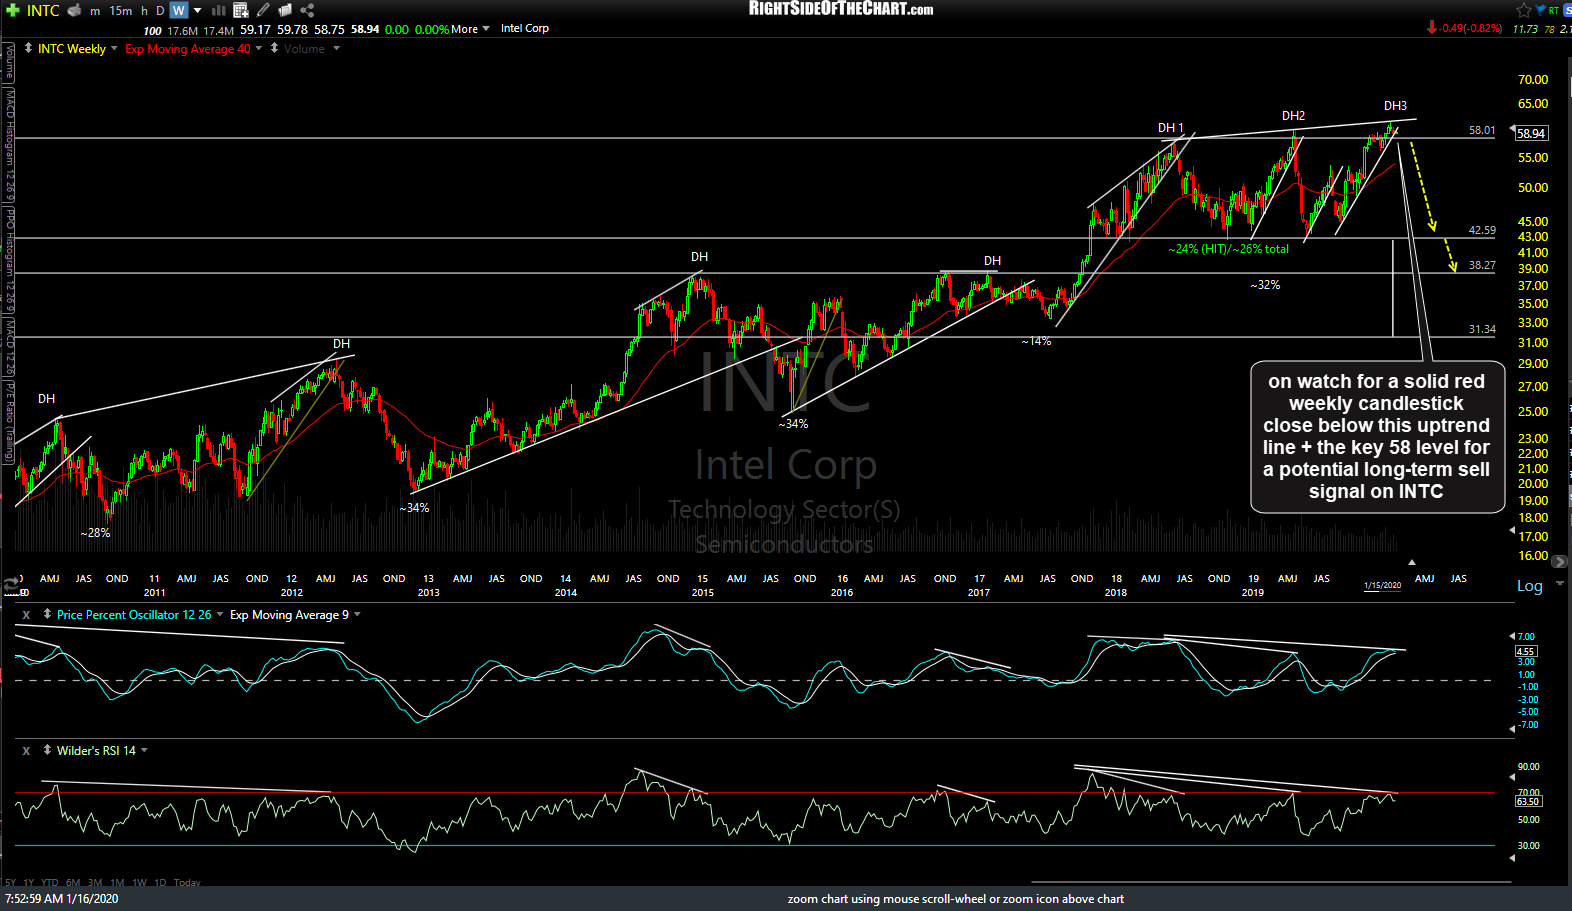
INTC weekly Jan 15th close
As the primary trend in the major stock indexes, semiconductor sector, as well as INTC all, remain clearly bullish for now without any decent sell signals, I’m just passing this along as a trade setup for a potential swing trade on INTC. Should the industry-leading stock breakdown & start correcting soon, it would most likely drag many of the other semiconductor stocks as well as the major stock indices, especially the tech-heavy Nasdaq 100, down along with it.