
 As requested, I did receive feedback from several traders who are more familiar with Elliot Wave counts than myself and I wanted to say thank you to all who took the time to contact me. It was brought to my attention that the fact that the primary wave (4) should not move below the top of wave (1), as I had drawn, and so the wave count labels have been removed on the updated $SPX daily chart as shown here. Although I do find EW useful at times, for example the A-B-C, 3 wave corrective patterns often play out fairly well in providing a heads-up to when a typical correction might have run it’s course, I typically don’t incorporate the more complex patterns into my analysis but always welcome feedback and charts from those who do.
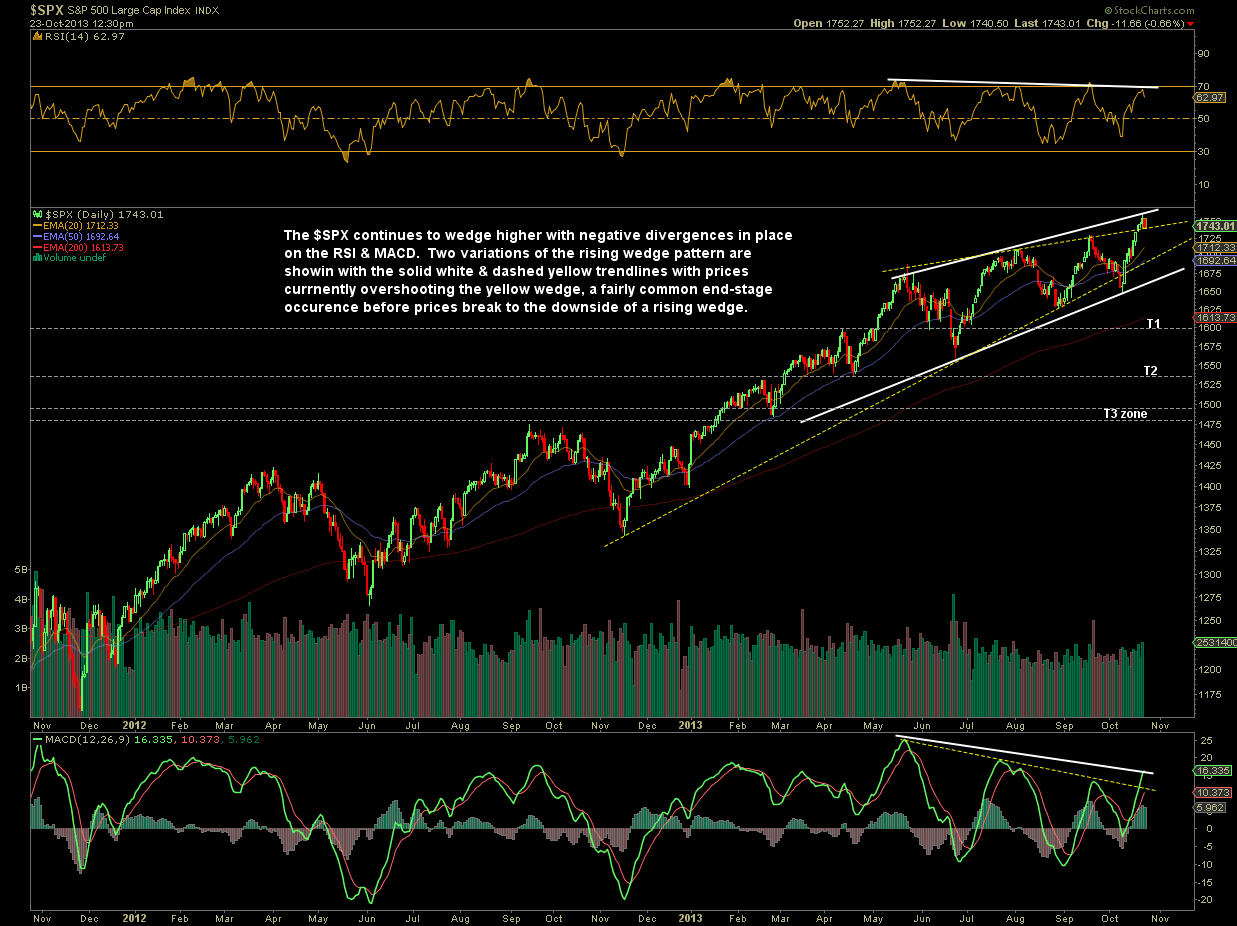
The most important development that I continue to focus on right now is the fact that most US indices continue to wedge higher while most key indicators and oscillators fail to also make new highs. In other words, we still have bearish rising wedge patterns with negative divergences in place, which is essentially the same pattern that was highlighted on those (incorrectly labeled) Ending Diagonal Patterns yesterday. Again, ED’s or not, the fact that prices are wedging higher while the MACD & RSI diverge is the most important development in the US equity markets at this time IMO. As long as these patterns remain valid (prices remain within or not too far above the top of the wedges and/or divergences no longer exist), the odds for a substantial correction/trend reversal remains elevated.
The updated $SPX daily chart above, which can also be viewed by clicking here, shows two minor variations of the rising wedge pattern. The wedge defined by the yellow dashed lines has prices recently overshooting the top of the wedge, an occurrence often seen before prices move sharply back within and then below the bottom of the wedge pattern. The solid white lines show a slightly different variation of the wedge pattern. I will often use a pair of similar trendlines when I either can be drawn connecting multiple candlestick bodies and shadows (wicks/tails) if both seem valid. If watching two uptrend lines and/or an uptrend line and horizontal support level in close proximity, I will usually wait until the lower of the two is broken before stopping out of a long position or establishing a full short position in order to avoid a false sell signal when the first support level is broken. Again, thank you to those who provided feedback and useful links/charts regarding Ending Diagonal patterns.