
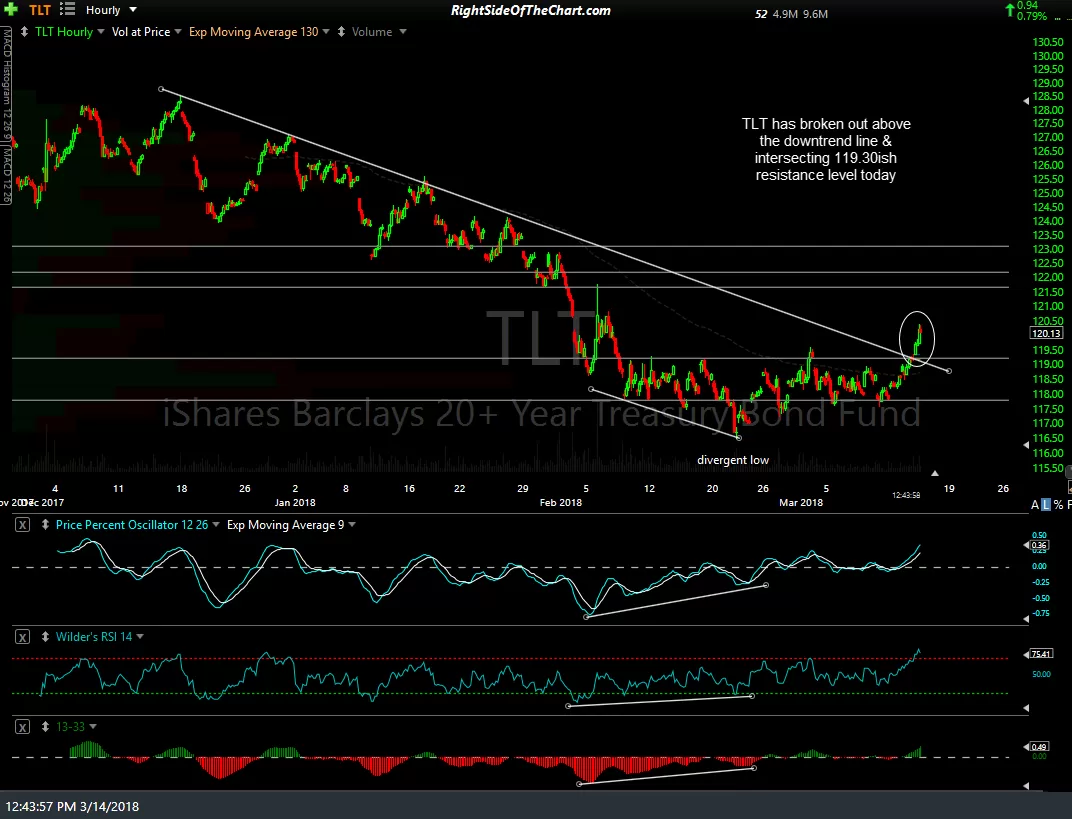
TLT (20+ Year Treasury Bond ETF) has broken out above the 119.33ish resistance level as well as this potential downtrend line on the 60-minute chart , which opens the door for a continued move up to the second price target* at 122.06. Previous & updated daily charts followed by the updated 60-minute chart of TLT below:
click on first chart to expand, then click on the right to advance to the next expanded image or pinch-zoom on mobile
-
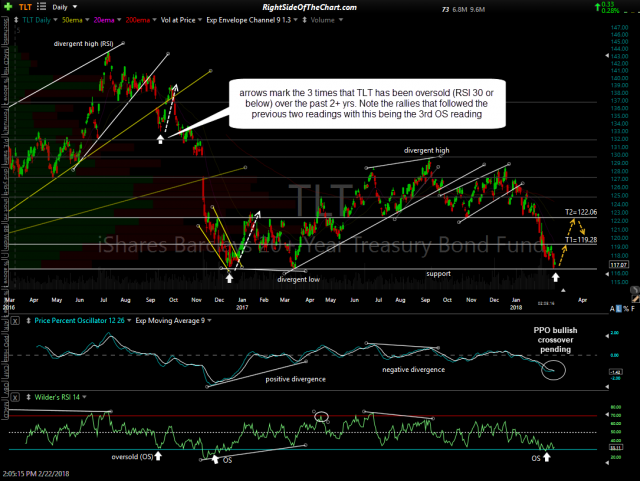
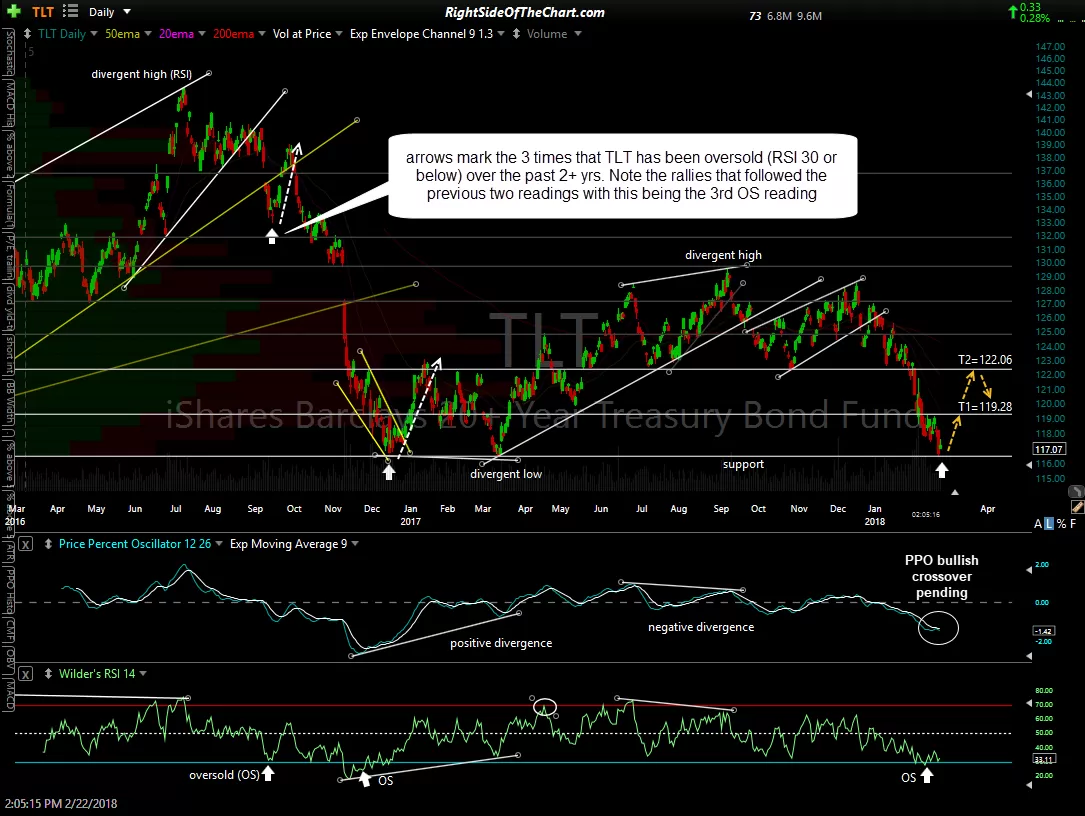
- TLT daily Feb 22nd
-
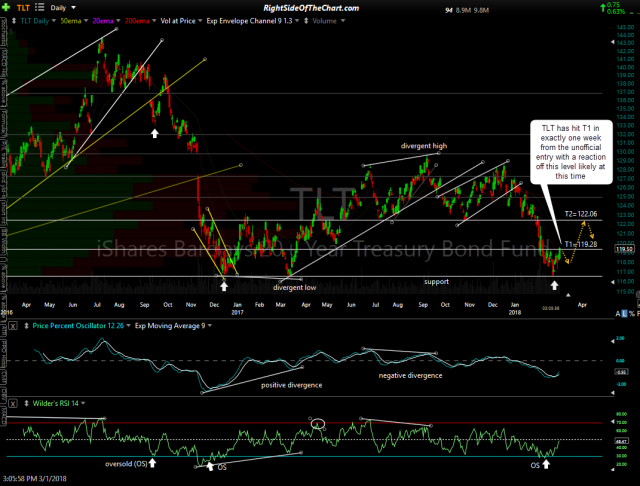
- TLT daily March 1st

-
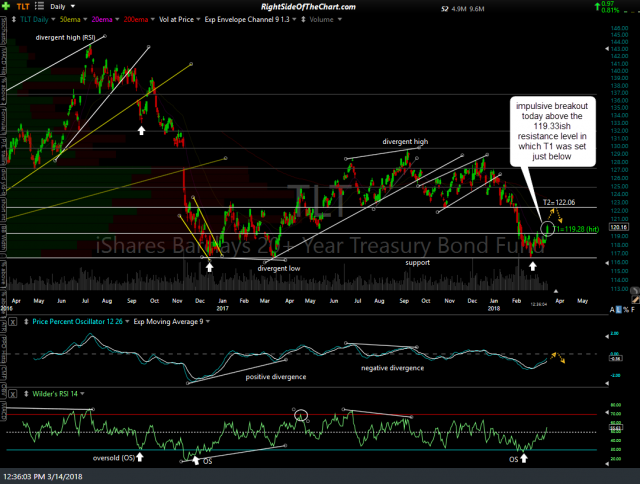
- TLT daily March 14th

-

- TLT 60-min March 14th
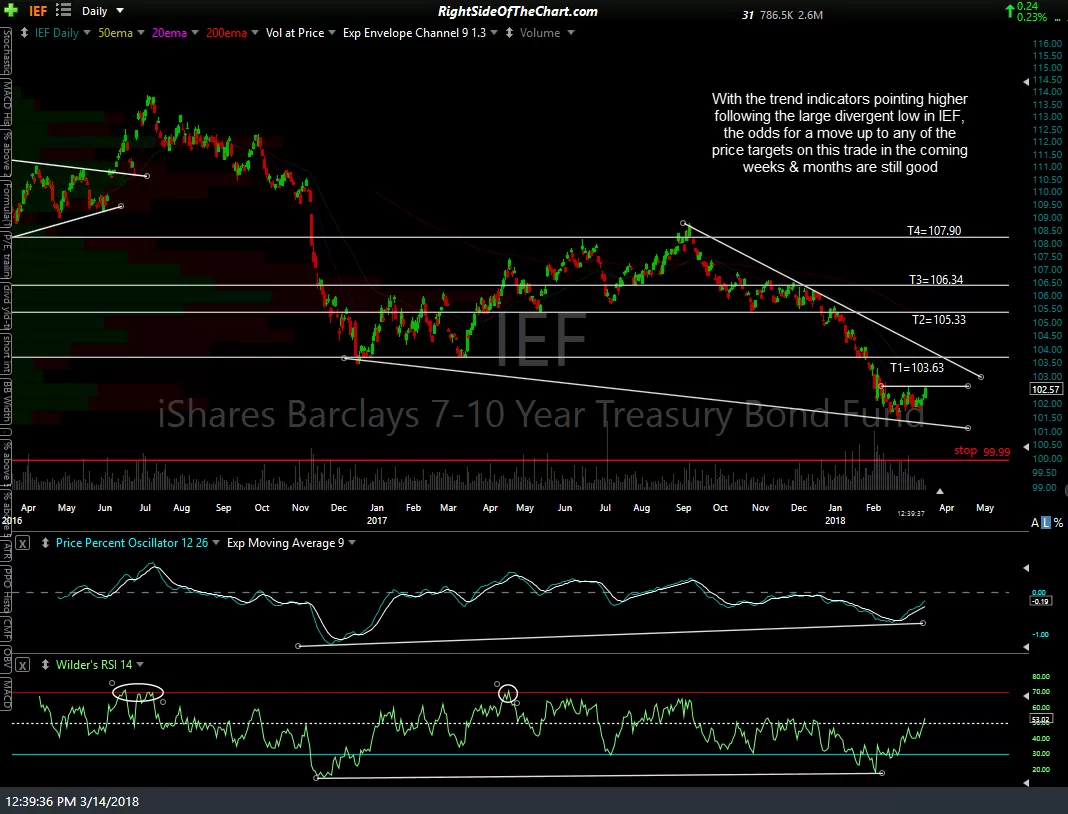
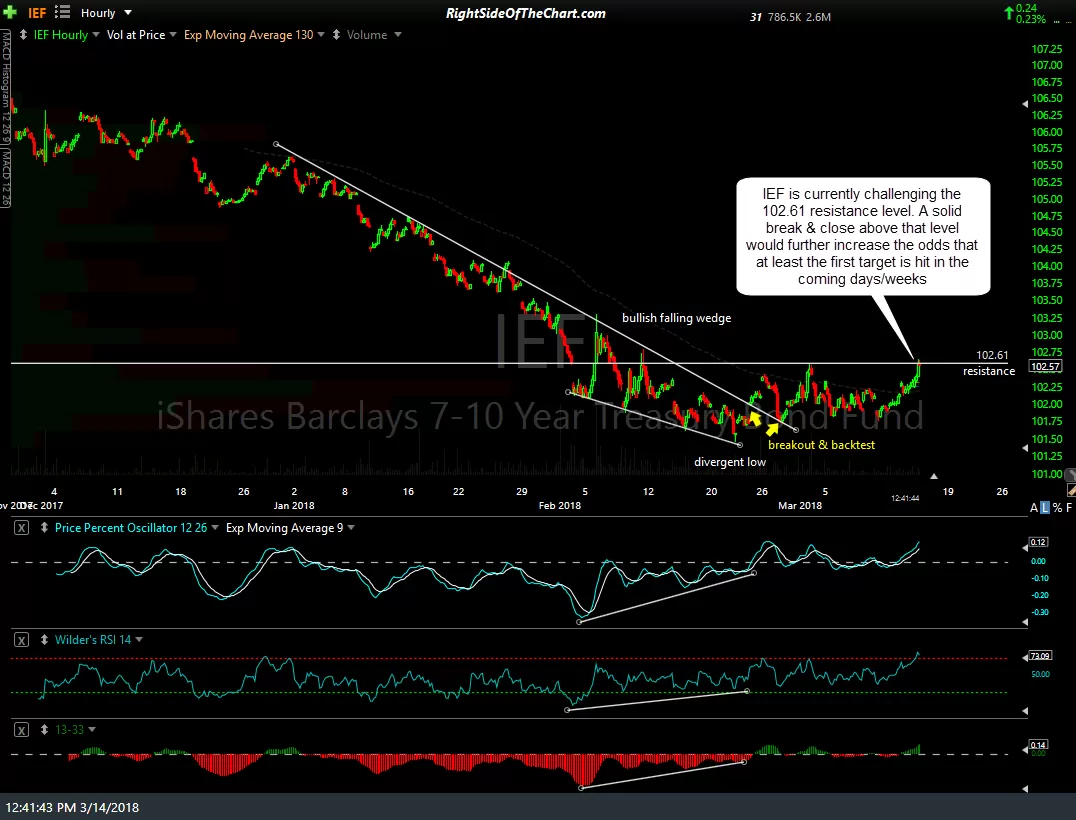
IEF (7-10 year Treasury ETF) is currently challenging the 102.61 resistance level. A solid break & close above that level would further increase the odds that at least the first target is hit in the coming days/weeks. With the trend indicators pointing higher following the large divergent low in IEF, the odds for a move up to any of the price targets on this trade in the coming weeks & months are still good. Updated daily & 60-minute charts below:
-

- IEF daily March 14th
-

- IEF 60-min March 14th
*TLT is was added recently as an unofficial trade as IEF was already an Active Trade at the time & the two ETFs are very similar, both holding US Treasury bonds with IEF holding intermediate-term bonds & TLT holding long-term bonds.