
GREK (Global X FTSE Greece 20 ETF) is currently testing key uptrend line support while Greece 10-year government bonds are approaching the key 4.5% resistance level. GREK topped back on January 2nd with Greece bond yields bottoming the following day as shown in the 2-year daily chart below. Click on the chart to expand, then pan & zoom for additional details.
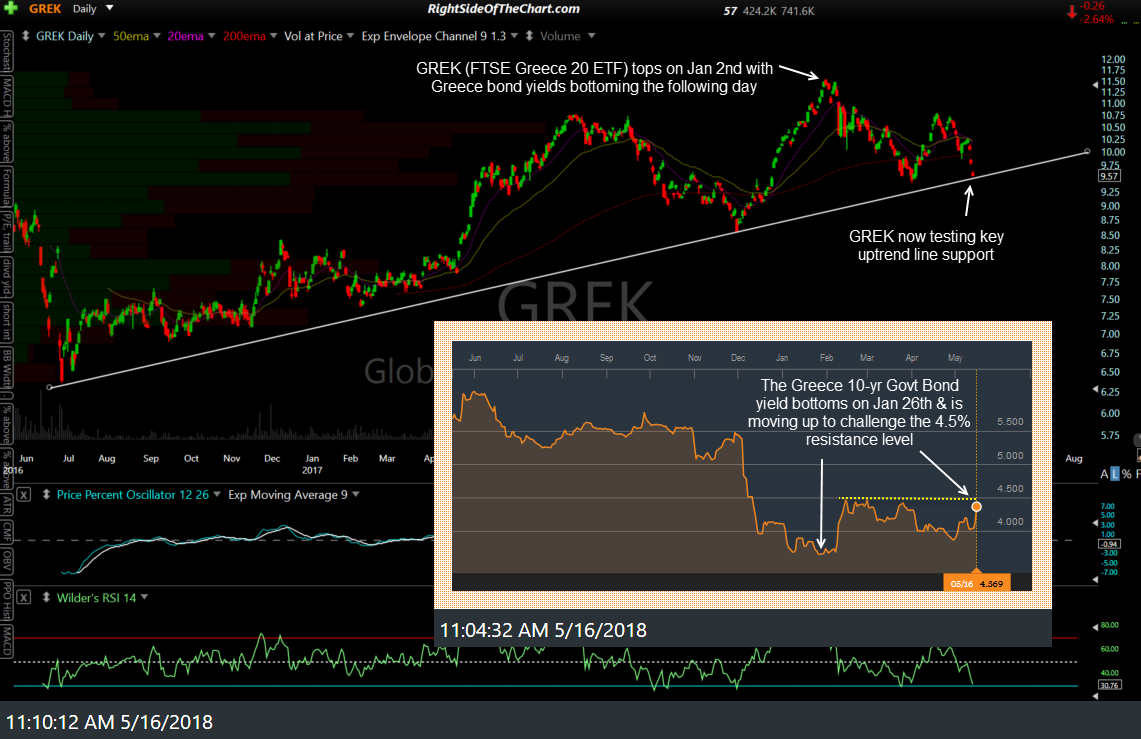
GREK daily May 16th
Zooming out a 10-year weekly chart we can see that GREK topped back in March 2014 followed by a 78% bear market with Greek bond yields climbing shortly afterward to reflect the increasing default risk as Greek stocks fell. While GREK could certainly bounce off this trendline & rally from here, the recent divergent high on the weekly chart warns of an increased likelihood of a trend change following the 108% bull market off the early 2016 lows.
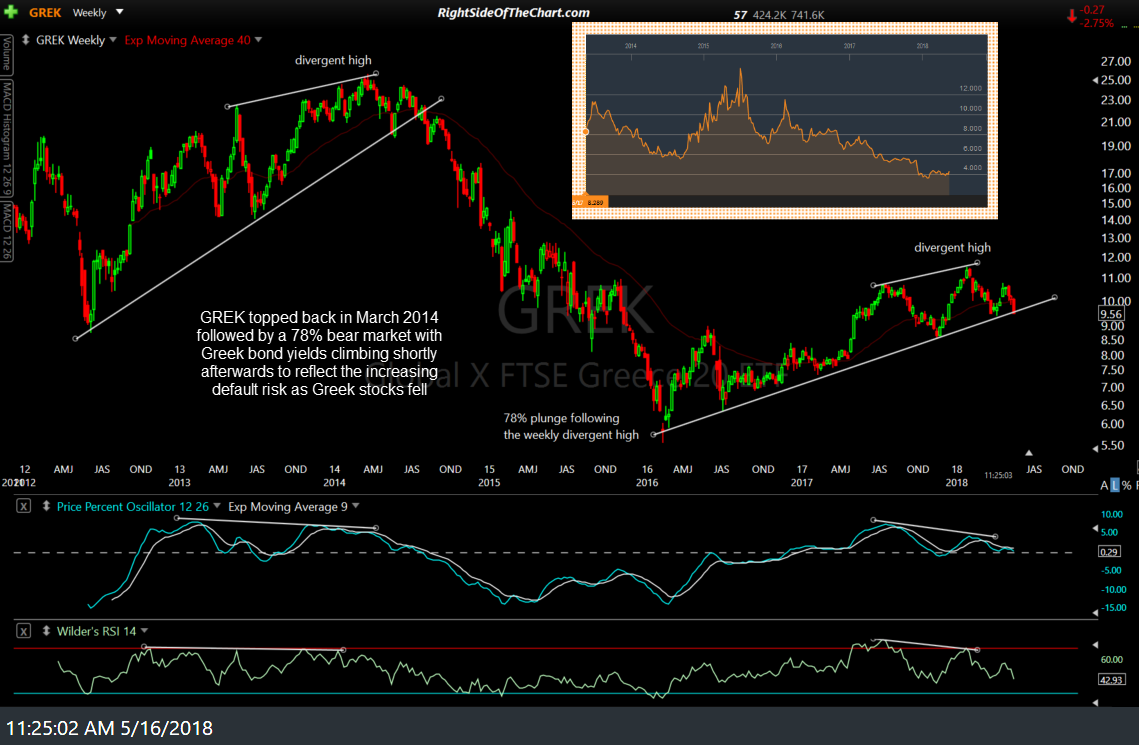
GREK weekly May 16th
Keeping an eye on the Greece 10-year bond yield, particularly that 4.5% level, might give us some insight as to whether on not GREK will likely break support & continue lower or may bounce here with a resumption of the uptrend in the coming months.
I don’t plan to add GREK as a trade idea at this time as I would prefer to see how these levels on both GREK & the Greek 10-yr gov’t bonds are resolved. I also plan to spend some time today reviewing the charts of other global equity & bond markets for potential trading opportunities as well as to get a better read on where global equity markets, including the U.S., might be headed going forward.