The odds for a reversal in gold continue to build as $GOLD (continuous futures contracts, 6+ year daily chart below) has recently crossed above the 70 level on the RSI. The red boxes highlight a fairly simply but consistent pattern of intermediate tops & bottoms in gold when the RSI crosses above or below the 70 (overbought) & 30 (oversold) levels. As I often say, oversold should not be used as a stand-alone sell signal, rather it is merely an indication that the end of the current uptrend may be close at hand but any sell signal should be confirmed with other technicals, such a divergences, trendline or support breaks, candlestick reversal patterns, etc..
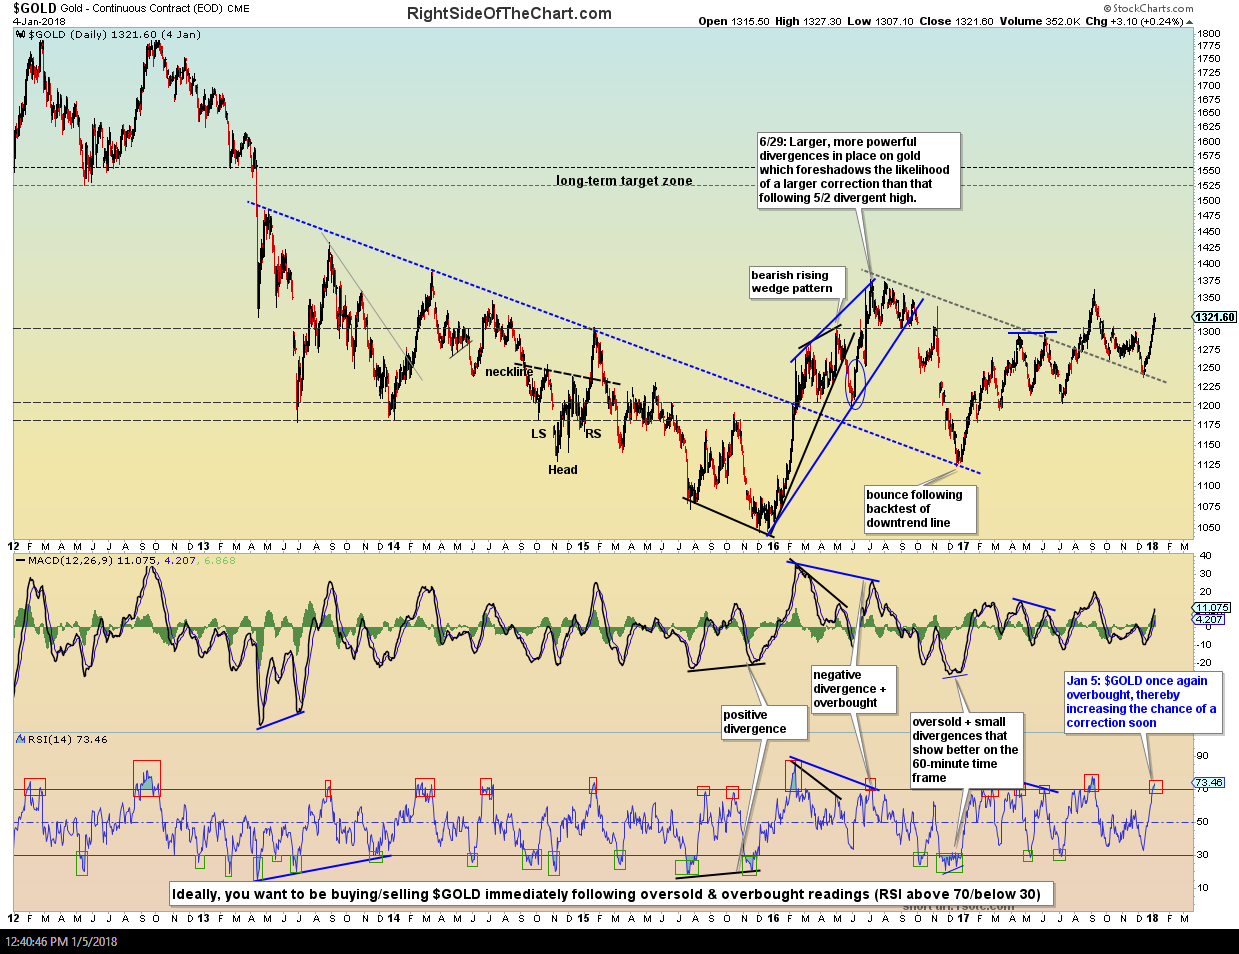
$GOLD daily Jan 5th
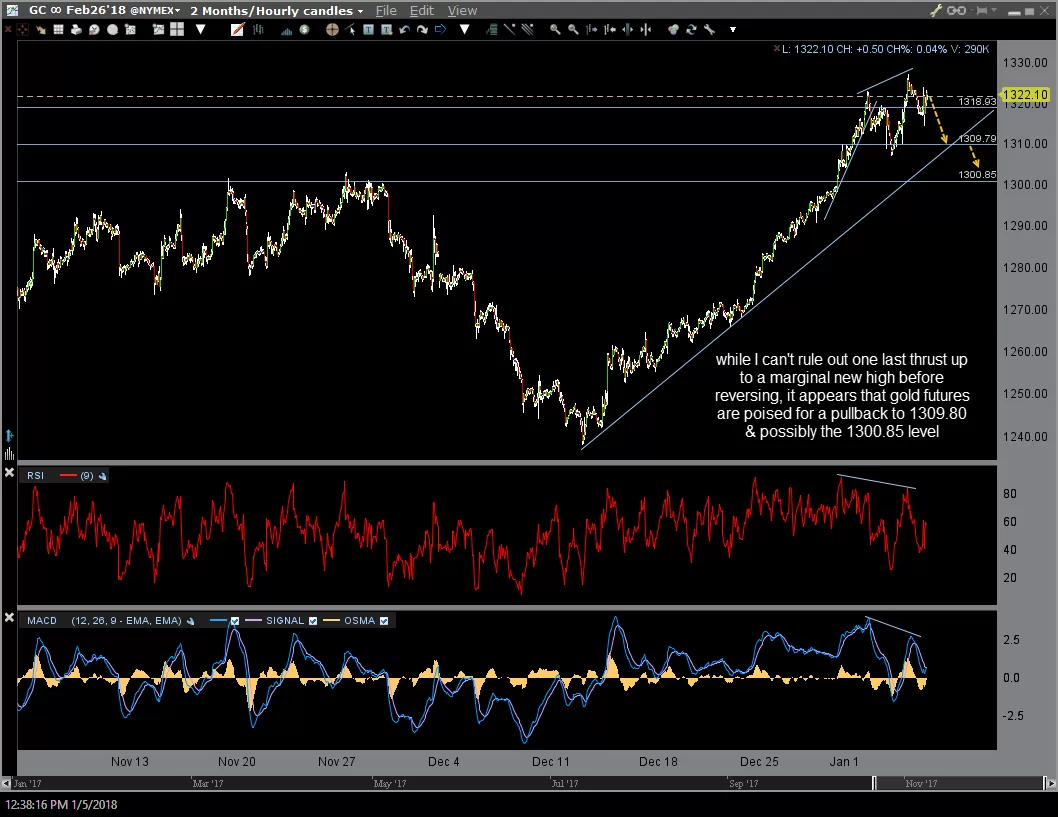
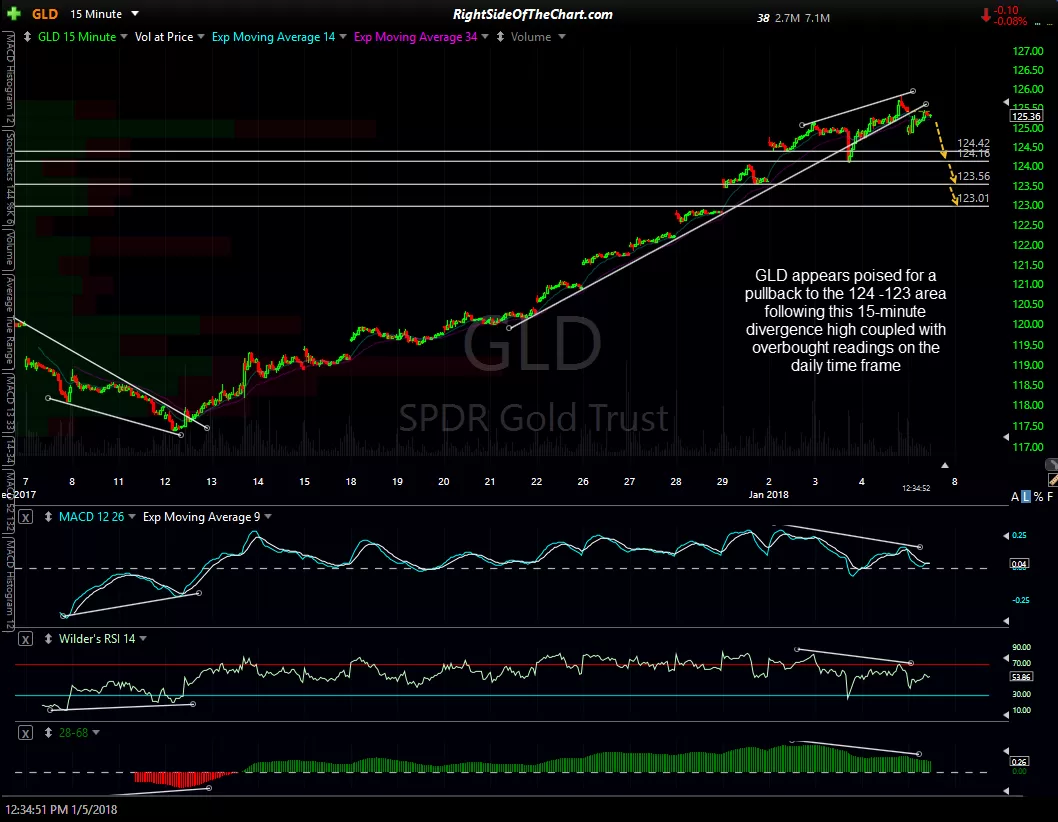
Zooming down to a 60-minute chart of /GC as well as a 15-minute chart of GLD, we can see that both had confirmed negative divergences in place at yesterday’s highs before reversing. While I can’t rule out one last thrust up to a marginal new high before reversing, it appears that gold futures are poised for a pullback to 1309.80 & possibly the 1300.85 level and at the very least, the R/R to a long position in the near-term is rapidly diminishing at this time. I don’t see much in the charts to indicate that longer-term investors & trend traders should be overly concerned with as I’m only expecting a relative minor correction in gold at this time but we’ll just have to assess the charts going forward to determine exactly how far the next pullback in gold might be.
-
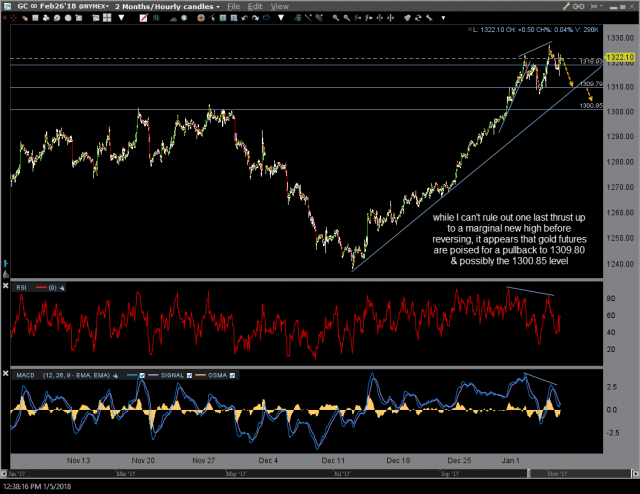
- GC 60-min Jan 5th
-
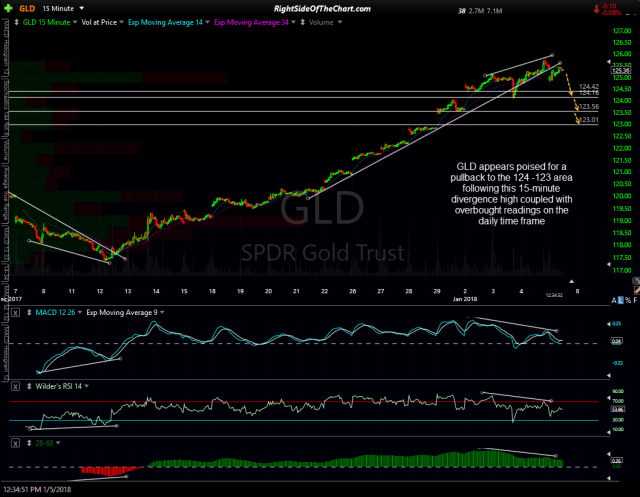
- GLD 15-min Jan 5th
GDX (gold miners ETF) also appears poised for a pullback to at least the 23ish area following the recent 60-minute divergent high & price channel breakdown + backtest. Of course, whether or not that occurs soon & just how far GDX pulls back will largely depend on how gold trades.
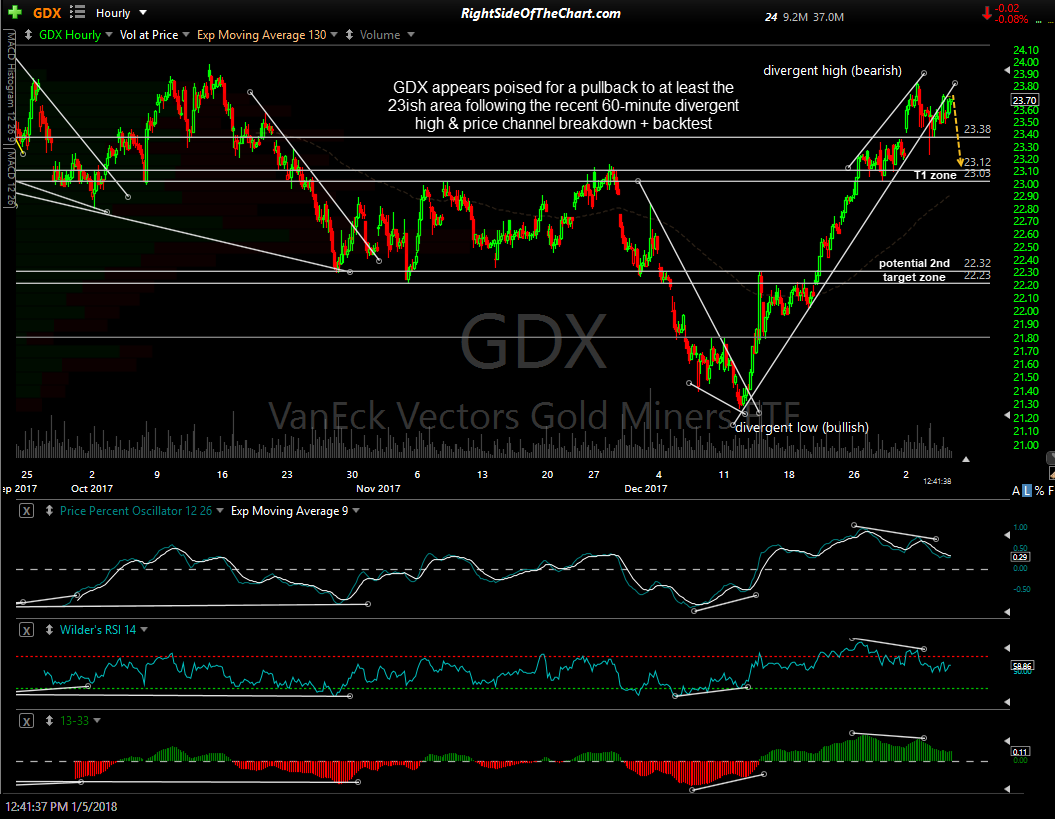
GDX 60-min Jan 5th
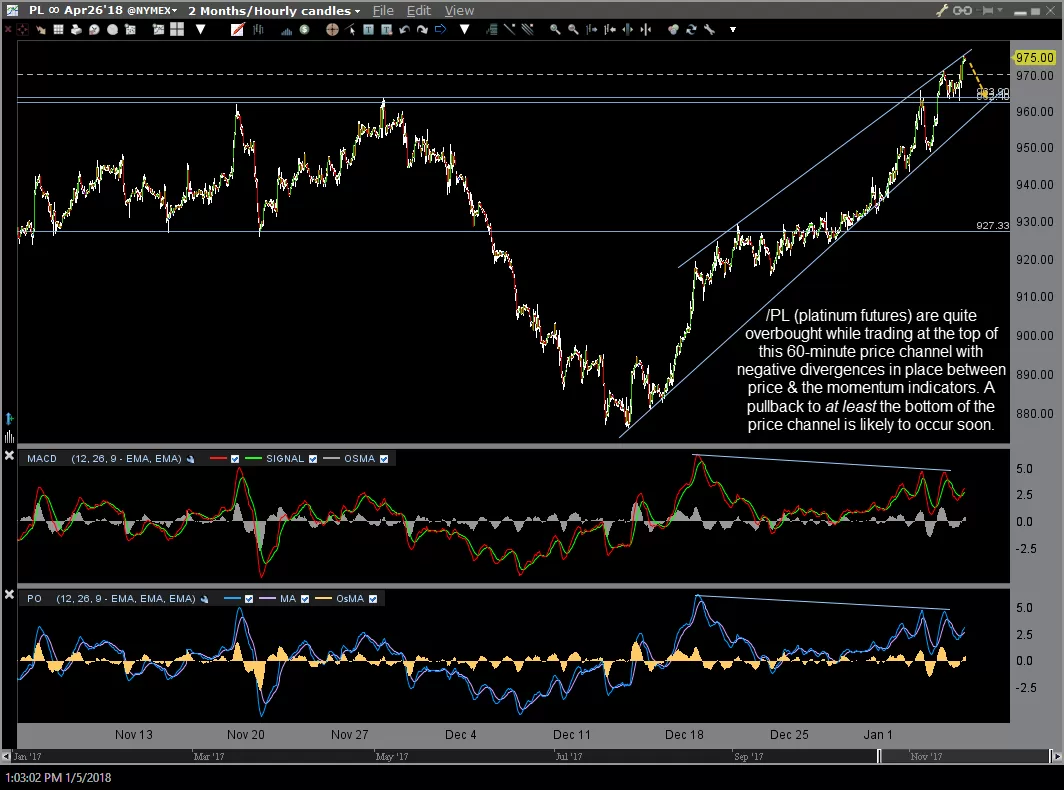
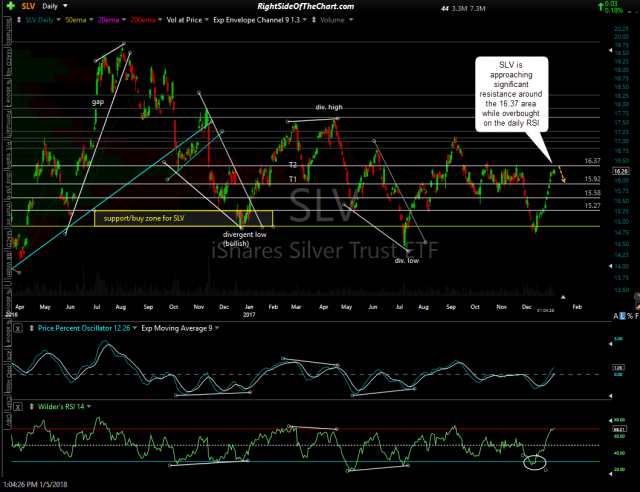
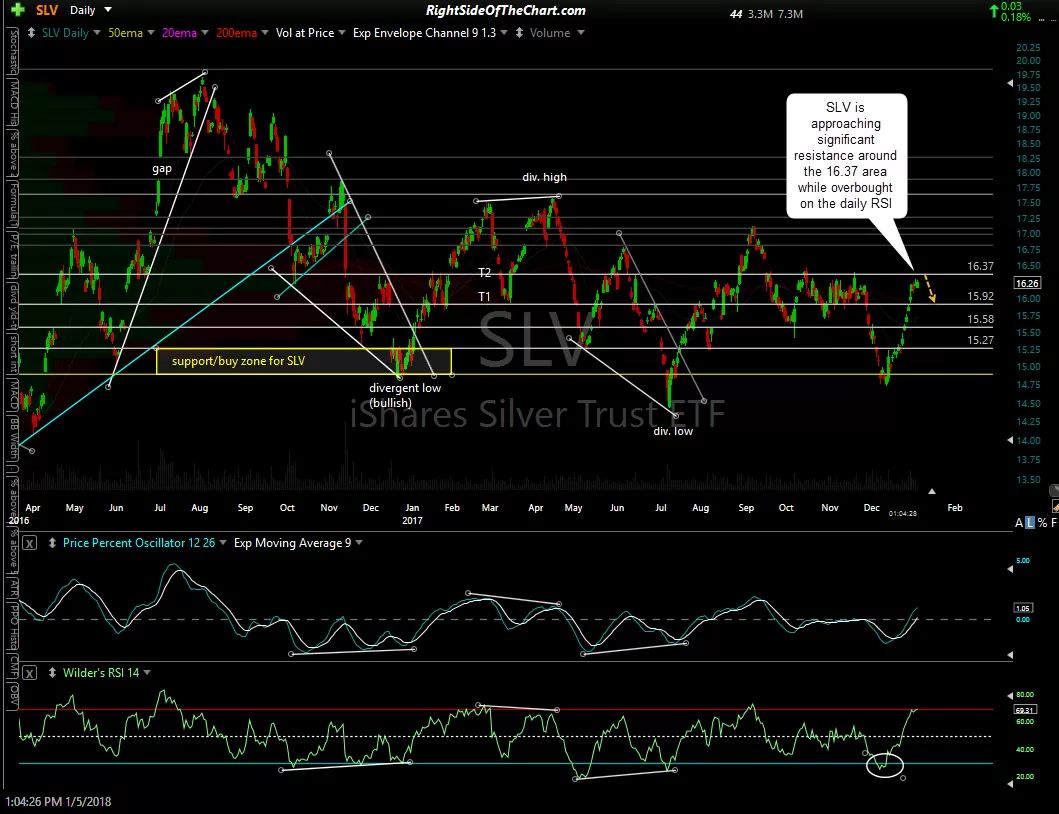
A couple of related charts: SLV (silver ETF) is approaching significant resistance around the 16.37 area while overbought on the daily RSI. Many of the components of GDX mine silver as well as gold & as such, are directly impacted by silver prices. /PL (platinum futures) are quite overbought while trading at the top of this 60-minute price channel with negative divergences in place between price & the momentum indicators. A pullback to at least the bottom of the price channel is likely to occur soon.
-
- SLV daily Jan 5th
-
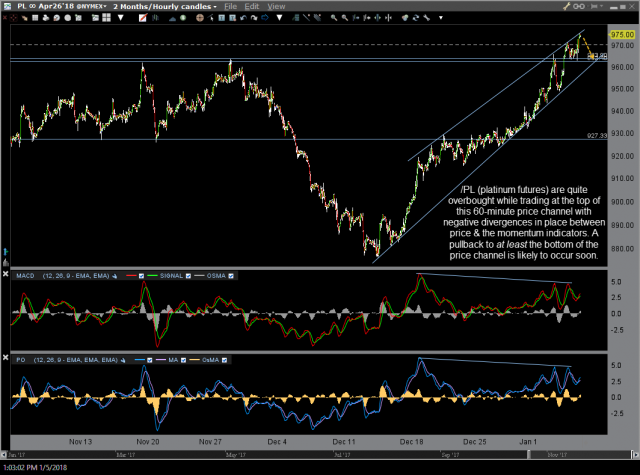
- PL 60-min Jan 5th