
EUR/USD (Euro/US Dollar) continues to test the long-term support zone on the weekly chart with all previous drops to this level followed by substantial rallies/trend reversals. As the EUR/USD and gold are positively correlated, a substantial rally off this level would most likely spark the next leg up in gold.
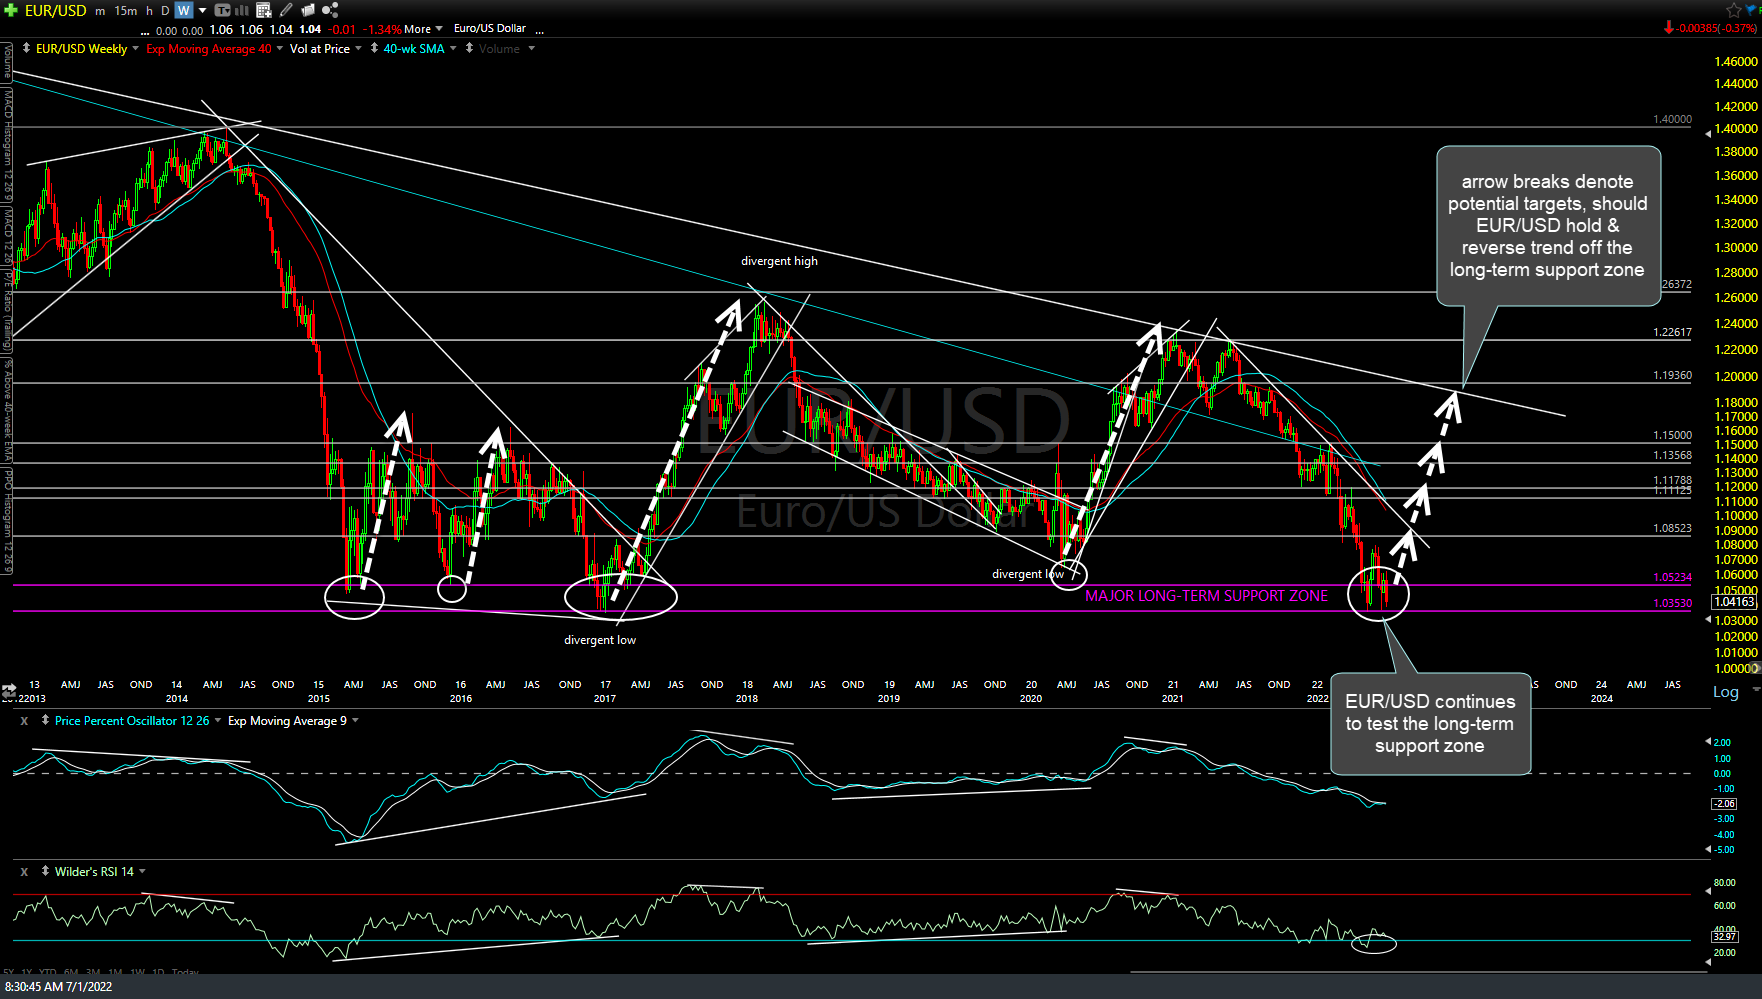
EUR-USD weekly July 1st
On the weekly chart, GLD (gold ETF) is backtesting the downtrend line & still above the 164.80ish support on the weekly chart. The next major trend (bullish or bearish) will likely depend on whether or not the EUR/USD rallies off the current long-term support zone or breaks & drops considerably below it.

GLD weekly July 1st
Zooming down to the daily time frame, gold has pretty strong but still potential (i.e.- not ‘confirmed’) divergences building on the PPO & RSI as GLD tests the 168 support. Any marginal new low soon would still be a divergent low although a substantial drop much below the next support around 165 would likely negate (take out) the divergences. Should GLD reverse soon, the next buy signal could come on a breakout above the primary downtrend line.

GLD daily July 1st
On a related note, GDX (gold miners ETF) punched down through the 28.93 support but as per last Friday’s video, I’m willing to give it a little room as per the nature of the volatile mining stocks & increased occurrence of whipsaws in just about all asset classes over the past few quarters. Also, note that GDX is coming up on pretty decent support around 26.15 with the divergence still intact & within the falling wedge pattern. As with gold, a buy signal would come on a solid break above the downtrend line and/or recovery back above the 29 level.

GDX daily July 1st