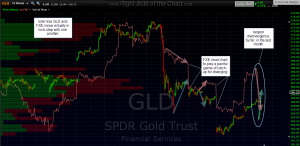
here’s a one month, 15 min chart showing GLD vs. FXE (euro etf). note how the two almost always move in virtual lock-step and the few occasions that prices divergence, there has always been a sharp correction (reversion to the correlation) between on or the other. the last two times this happened, FXE paid the price. if my EUR/USD scenario stops playing out, then it will probably happen again. if not, it’s GLD’s turn to take it on the chin. this current divergence is by far the sharpest, at least on the time frame below.
note: when viewing the price correlation between the two, remember that they do not, nor should they be expected to move dollar for dollar in price. therefore, the widening and narrowing of the spread on these two price plots is to be expected. what you want to focus on is the DIRECTION that each price is moving in at any one time. you are looking for divergences in the direction (up or down) of prices, not necessarily a widening or narrowing of the two price plots.


