Not only are these two levels (120.28 & 119.16) decent price support, they are also the 50 &61.8% Fibonacci retracements of the most recent rally in GLD. Should 120.25 go, GLD will likely continue down to at least the 119.15 area/61.8% Fib (60-minute chart):
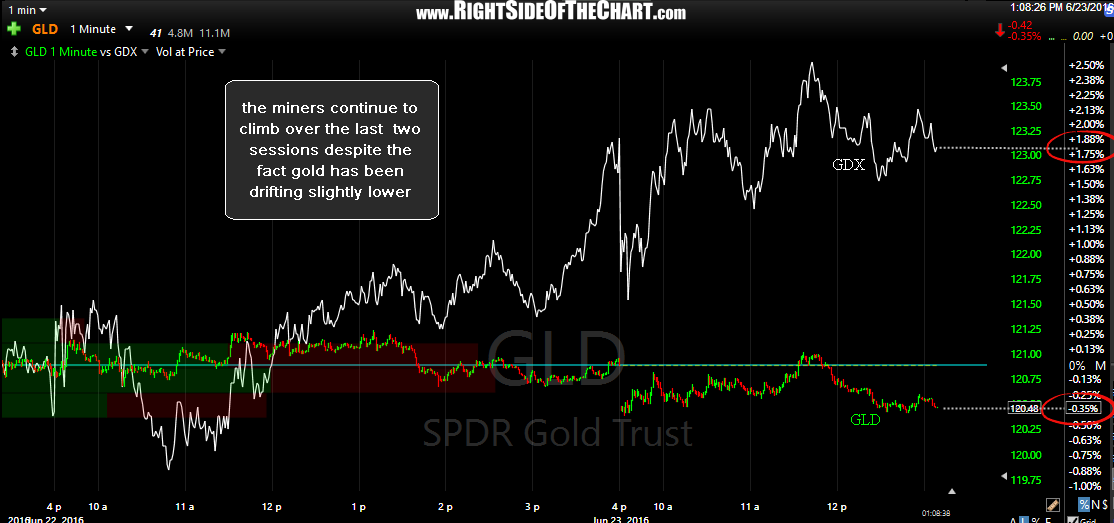
Should these divergences play out for another significant correction in GLD, such as the nearly 7% drop last month, then the gold mining stocks will almost certainly follow suit by matching or exceeding their recent 16% correction in May. I posted this 1-minute chart of GLD vs. GDX in the trading room earlier today highlighting the fact that GDX has climbed nearly 2% over the last couple of trading sessions despite the fact that GLD has moved lower. As such, one or the other is likely to play catch-up to the other next week.


