
GLD is testing key support: 1) The backtest of the recent bullish pennant/triangle breakout formed by the blue downtrend line & white uptrend line below and.. 2) the bottom of the ascending price channel formed by the parallel white lines and.. 3) horizontal support from multiple recent gaps (dotted yellow line). Should this confluence of support break, my minimum downside target would be the 113ish level, which is defined by the top of the Feb 8th gap + the 38.2% Fibonacci retracement of the rally off the December 17th lows on GLD. While at least a minor reaction here on the initial tag of these intersecting support levels is likely, should this scenario play out with GLD going on to break below this support level, GDX will most likely move sharply lower along with GLD.
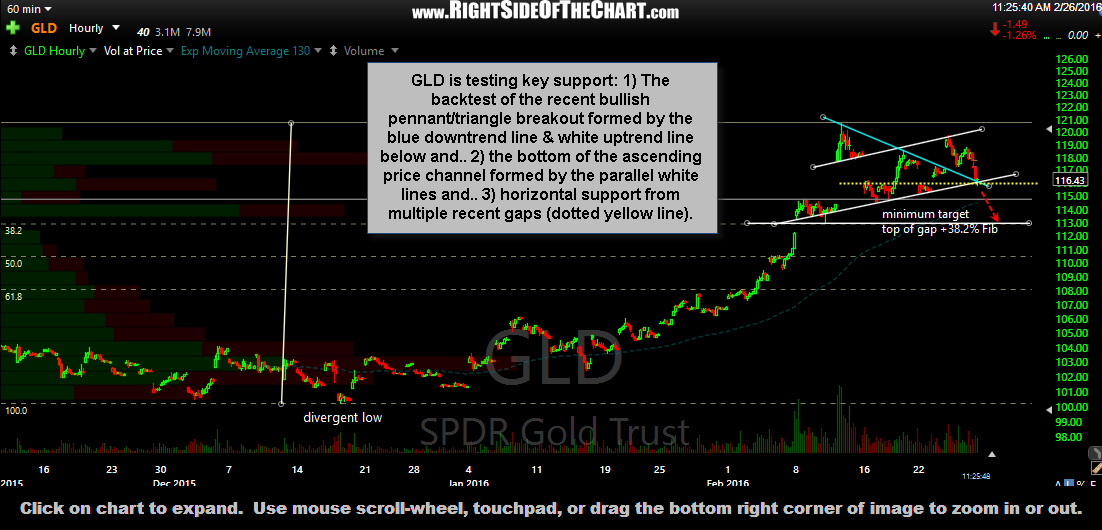
GLD 60-minute Feb 26th