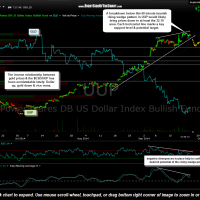
A breakdown below this 60 minute bearish rising wedge pattern in UUP would likely bring prices down to at least the 22.19 area. Each horizontal line marks a key support level & potential target. This chart also shows the very tight inverse correlation between gold (GLD) and the $USD (UUP) over the past several months. Therefore, a breakdown of this bearish rising wedge pattern in UUP will likely spark a rally in gold prices. Although any of these support levels are likely to be hit, my preferred near-term target at this time would be the top of that Sept 4th gap at 22.19. Also keep in mind that a case for a long-term top in the $USD was recently made here & here. Therefore, this 60 minute pattern certainly has the potential to morph into something more based on the weekly & monthly charts of the $USD.
Also note GLD has already broken out to the upside of this 60 minute bullish falling wedge pattern. However, the odds for a tradeable rally (and possibly more) in gold & the miners will rise considerably if/when UUP confirms via a breakdown of the rising wedge pattern.
- UUP vs. GLD 60 minute
- GLD 60 minute Aug 23rd


