
Most are aware of the inverse correlation between the U.S. Dollar ($USD) and gold prices ($GOLD). Although, as with most price relationships in the financial markets, shorter-term disconnects between this correlation exist from time to time but when viewed over longer time periods, such as this 20+ year monthly chart, the inverse correlation between the major trends in the dollar and gold becomes clear. There are also a few very important developments to note on the $USD. First would be the fact that the $USD had been consolidating within a very large, multi-year triangle pattern as shown on the chart below. In fact, this most recent sharp rally in the dollar, which was largely the cause of the recent drop in gold, has brought the $USD right up to the top of that triangle pattern, a key resistance level. This most recent kiss of that downtrend line, which generates off the November 2005 highs in the dollar, marks the 5th tag of the top of the pattern. While an upside breakout of the dollar is certainly a possibility, resistance is resistance until broken and this triangle pattern is very large and long in duration, I’d prefer to wait for a solid monthly close above or below the pattern in order to confirm a breakout in the dollar.
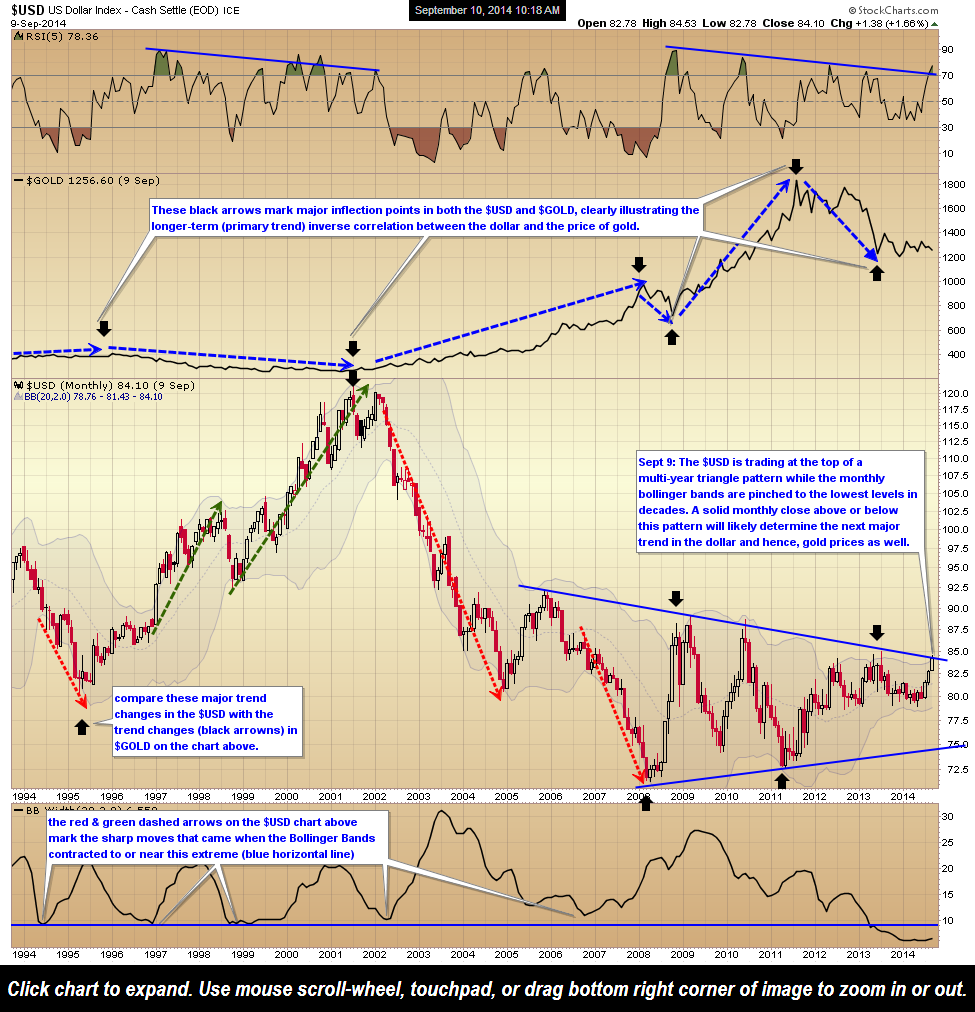
One other point of interest with the $USD would be the recent extreme contraction in the monthly Bollinger Bands. Typically, when the Bollinger Bands pinch, which is a result of decreasing price volatility such as prices working their way towards the apex of this triangle pattern, that “pinch” in the Bollinger Bands usually precedes a very powerful unidirectional move (i.e.- a breakout). With the Bollinger Bands at the tightest level in over two decades, my guess is that the next big move in the dollar is coming sooner than later. That would most likely indicate one of two scenarios: Either the dollar goes on to make a bullish breakout and sustained rally above the triangle pattern OR the $USD is rejected off of the top of the pattern and moves lower towards the bottom of the pattern and ultimately breaking down below. I lean towards the latter scenario (a new bear trend in the dollar, new bull market in gold) but will certainly respect a breakout in either direction.
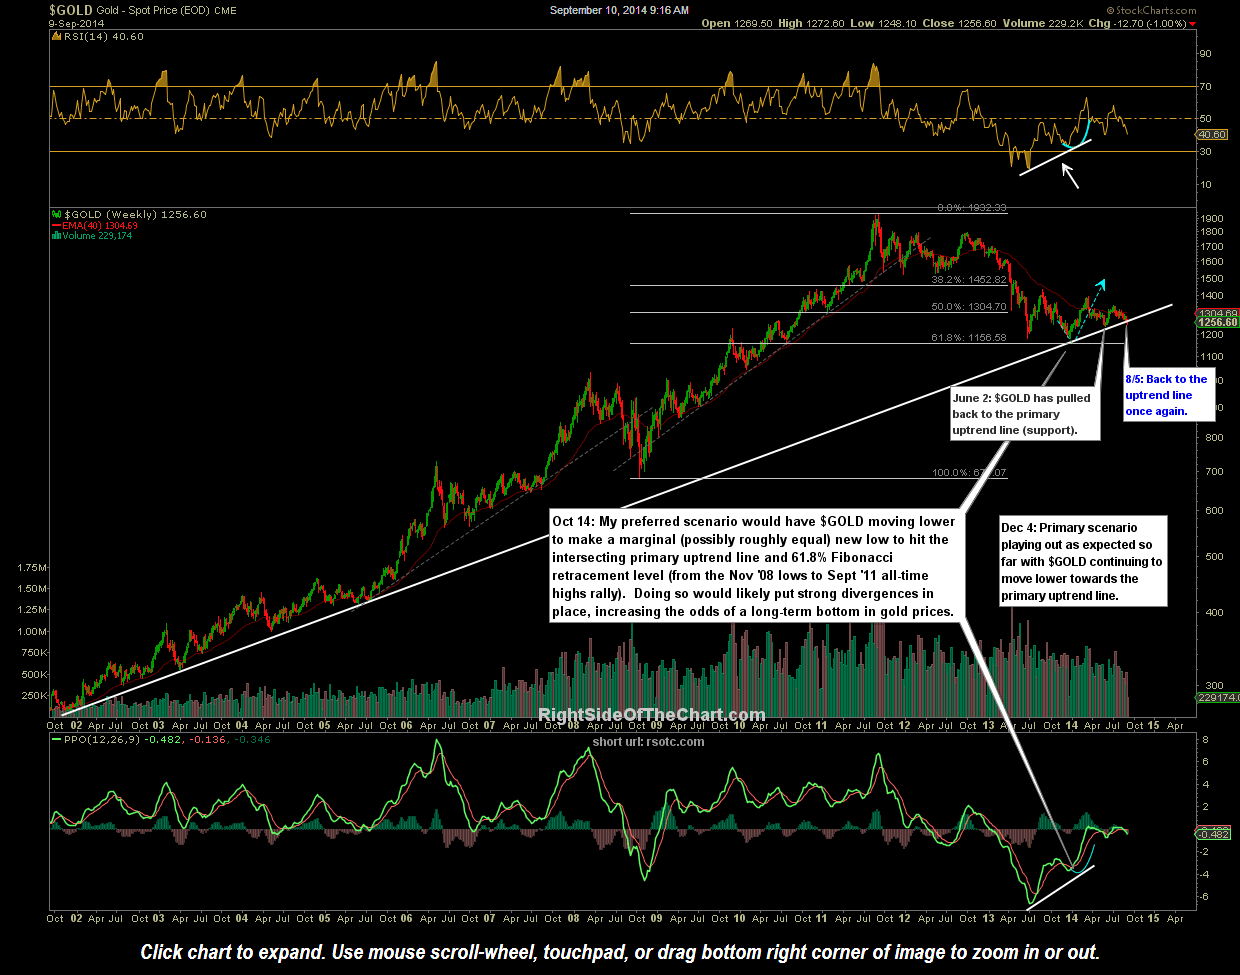
The fact that the $USD is challenging a major, multi-year downtrend line (resistance) from below while $GOLD is testing a major multi-year uptrend line (support) from above is far from a coincidence IMO. While I prefer to wait for a monthly close above the triangle pattern on the dollar, I am concerned that a solid weekly close below the long-term uptrend line on the $GOLD weekly chart would open the door for a test of the mid & late 2013 lows, which would be about another 7-8% drop in gold prices. The bottom line is that both gold & the dollar can (and will) break either way from here as both are at critical technical levels at this time. How a trader or investor plays this is completely up to you. For those who are risk-adverse, preferring to align their positions with a clear primary trend, it would probably be best to hold off on trading gold & the mining stocks until we get a clear resolution of the triangle pattern in the $USD and confirmation that gold has either moved comfortably back above or below the key support levels on this weekly chart (the primary uptrend line first, then the mid & late 2013 lows). Those bullish on gold for technical and/or fundamental reasons could certainly be positioned long here with the appropriate stops in place, should gold break down with the dollar breaking up. When trading off the weekly & monthly charts, especially in a volatile sector like the precious metals and mining stocks, I find that using scale-in strategy with below average position sizes and larger than normal stops (which is off-set from an R/R perspective by the above average return potential) works best.
Finally, I just wanted to say thanks to those who sent feedback about the possibility of adding more short-term trade ideas like the 15 minute chart of GDX posted yesterday. As I received several requests to post more short-term trade ideas, I will look to do so in the future, especially at times like this when the market is more conducive to short-term swing trading (a couple of days to a couple of weeks) vs. the typical swing trade ideas shared on RSOTC, which have typically holding periods measured in weeks or months. I also wanted to share my reply to an inquiry that I received on that GDX bounce trade idea yesterday (cut & pasted below):
Q: Thank you so much for the latest two updates on GDX today, one before and the other after the close of trading You indicate that this bounce will last probably 1-2 days, giving your reasons Is there also a possibility that this is a genuine reversal that will last longer eg a few weeks ? Or is that completely out of the question ?
A: Great question. My thinking is this: Yes, there is certainly a fair chance of a lasting reversal off of this level for the reasons stated in the recent 60 minute chart of GDX and 4-hour chart of GLD & weekly charts of $GOLD. My thoughts are that the recent multi-month consolidation range on GDX, the bottom of which comes in around that 25.60 resistance level that I mentioned, is now likely to act as resistance in the near-term. Therefore, my preferred scenario would have GDX moving up to either the 25.09 area or the 25.60 area before pulling back or consolidating for a while before building the energy to make a sustained move up through and ultimately above that recent consolidation zone in GDX.
Of course gold prices will need to at least stabilize and preferably start moving higher before GDX has any decent chance of breaking above the recent consolidation zone. For now, it is just too early to tell if this will prove to be the end of a correction in the miners or if they have more downside to come in the days, weeks & months to follow. As of now I continue to hold my long-term positions in the mining sector but will begin to scale out if $GOLD prints a solid weekly close below the long-term uptrend line. This current GDX trade is nothing more than just a quick, counter-trend, oversold at support, bounce trade although it certainly has the potential to mark a more lasting reversal in the miners.