
The GDX (Gold Miners ETF) Active Long Swing Trade made an impulsive breakout above the bullish falling wedge pattern today after just avoiding a stop raid by 8 cents at the close yesterday, with GDX gapping down below the suggest stop of any daily close below 17.50 & then recovering just above that level by the end of the trading session. The impulsive nature of the rally following today’s wedge breakout helps to confirm the breakout & increase the chances that it will stick.
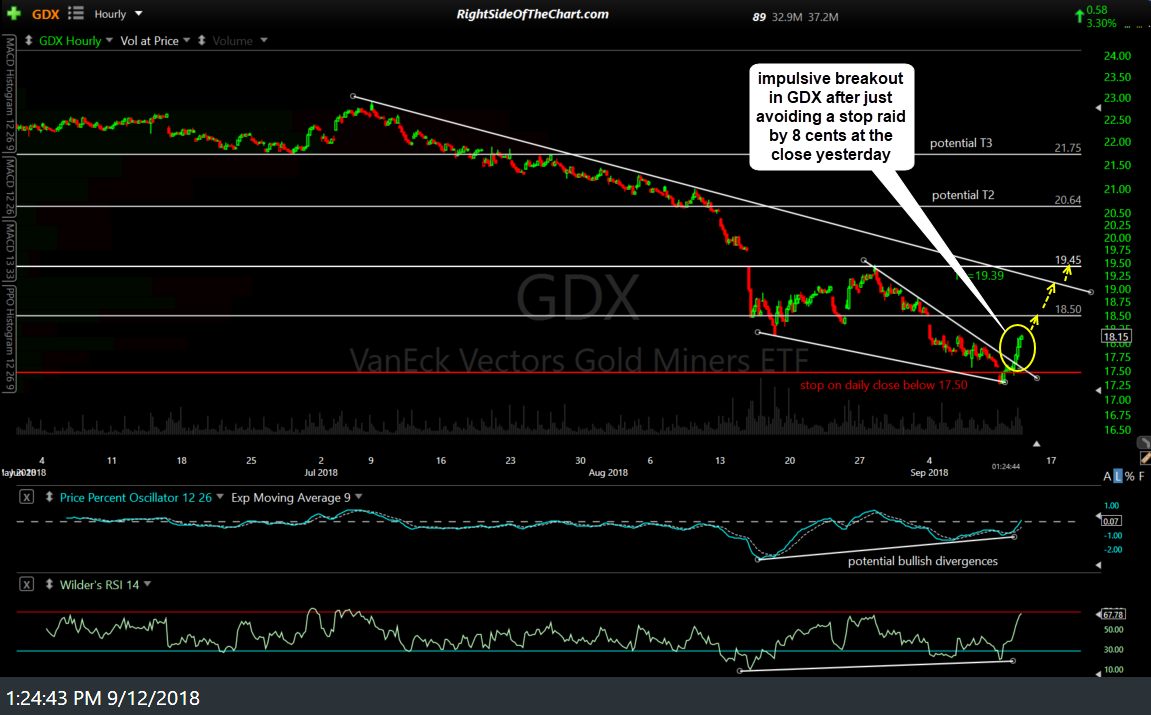
GDX 60-min Sept 12th
Of course, the success or failure of the GDX trade, to which I will most likely add additional price targets if gold breaks out soon, will hinge largely on what the shiny metal does in the coming days & weeks. For the last week or so in the trading room & in recent videos, I have been highlighting what I believe to be a very significant resistance level on the /GC (gold futures) 60-minute chart.
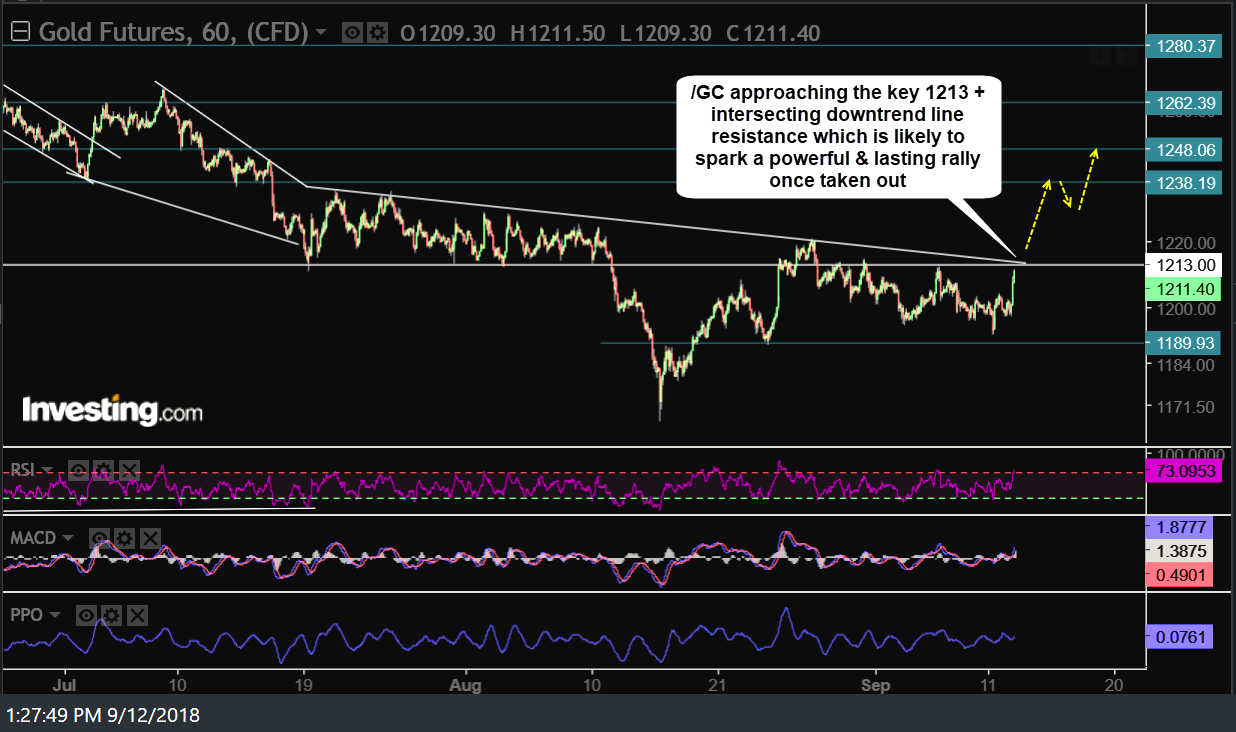
GC 60-min Sept 12th
That key level is the intersecting 1213 resistance level and the downtrend line off the mid-July highs. A solid break & daily close above those intersecting resistance levels could very likely spark a powerful & lasting rally in gold, taking the gold mining stocks along for a ride with it.