
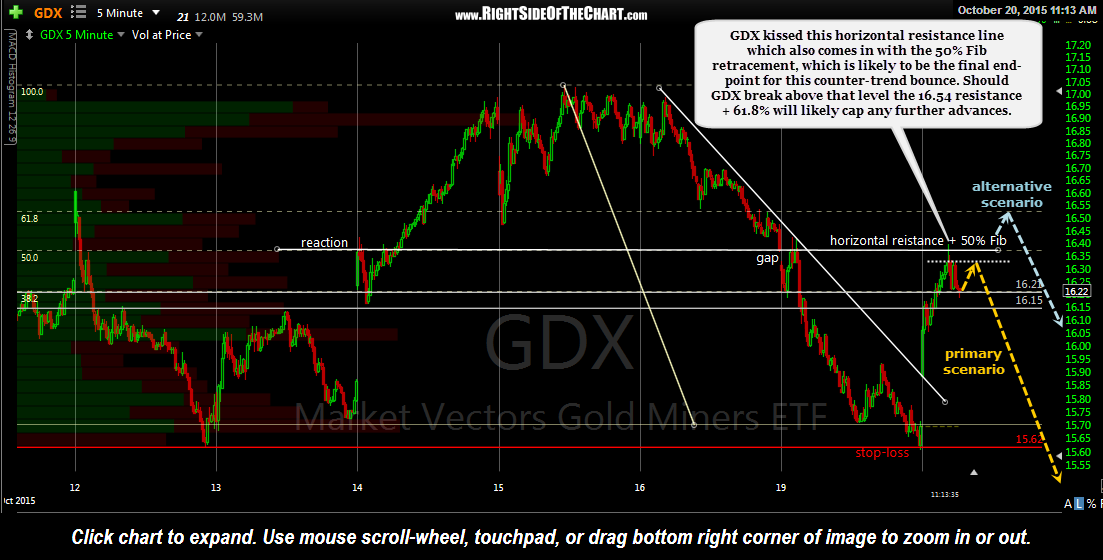
Earlier today, GDX (Gold Miners ETF) kissed this horizontal resistance line which also comes in with the 50% Fib retracement, which is likely to be the final end-point for this counter-trend bounce. Should GDX break above that level the 16.54 resistance + 61.8% will likely cap any further advances.
GDX 5 minute 2 Oct 20th
I have drawn the two most probable scenarios (orange & blue arrows) on this updated 5-minute chart. Personally, I’m sitting tight for the time being but will likely start added back some short exposure to the miners if/when GDX approaches the 16.30 area (where my primary scenario has it turning back down today) and continue adding up to but not beyond the 16.55 level.
Note: since I started working on this post after taking the screenshot of the chart, GDX climbed up to the 16.30 level so I went ahead & took a 50% position in DUST which I may or may not add to.