
Member @pangblood had asked for my thoughts on GDX (gold miners ETF) in the trading room. GDX has been caught up in the relative doldrums that the gold & mining sector has been in lately with a mostly sideways trading range that has taken the sector virtually nowhere over the last 6 or so weeks. My commentary on GDX has been light over this time period as 1) My read on the next direction in the miners hasn’t been very strong and 2) With the miners trading sideways for the last 6 weeks, there just haven’t been any new technical developments worth noting, at least until now.
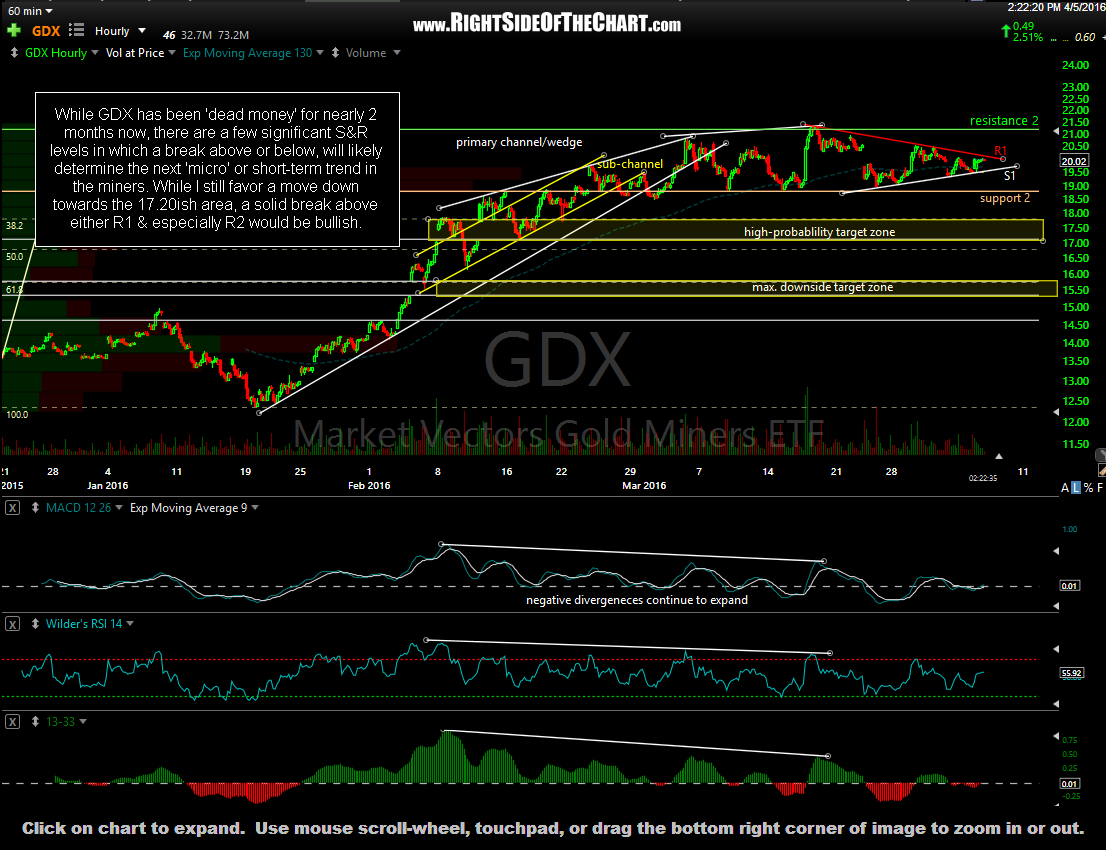
GDX 60-minute April 5th
The key levels that stand out to me on this 60-minute chart of GDX are the green (resistance 2) and orange (support 2) horizontal lines which have contained prices within this sideways trading range over the last 6 or so weeks. A solid break above or below either of those levels will likely determine the next near-term trend in the miners. At this time, I continue to favor a downside resolution & move down to at least the 17.20ish area although an solid upside breakout & especially a daily close above the green line (21.30ish level) would likely spark a rally in the miners that could last for several weeks or more.
Zooming in a bit, you’ll note the red & white trendlines that have recently formed a symmetrically triangle pattern in GDX. This pattern can certainly break either way & whichever direction it breaks (up above the red downtrend line or down below the white uptrend line) will likely bring GDX to the support or resistance level (S2 or R2) above or below the triangle.
As @pangblood was considering throwing in the towel on a GDX short, one thing to consider is that prices are close enough to the apex of this triangle that a resolution at this point will have to occur within hours or days. As such, a tight stop on a GDX short could be place above the top of the triangle (R1), possibly on a 15-60 minute close above, depending on one’s preference (the longer you wait, the lower the changes of a whipsaw signal but the more risk of loss or profit-giveback on the trade) while a more liberal stop could be placed above the R2 level (green line), preferably on a 60-minute to daily closing basis. For those long or considering a long position in GDX, the same stop parameters in reverse could be used on a break below the triangle (S1) or the S2 level.