
I’ve spent the better part of the morning trying to find some charts worth highlighting in a Charts I’m Watching Today post but I’ve come up mostly blank as very little stands out, other than the charts that were covered on the major stock indices, precious metals, Treasuries & natural gas yesterday (none of which have materially changed since then). One potential trade setup is Bitcoin via futures or the Bitcoin tracking GBTC, which is similar to an ETF and can be traded in a regular brokerage account as such.
/BRR Bitcoin could be good for a quick trade up to the 10109 & possibly the 10478 level* on a break above this downtrend line or a much longer-term swing short on an impulsive & solid break below the key 9454 support.
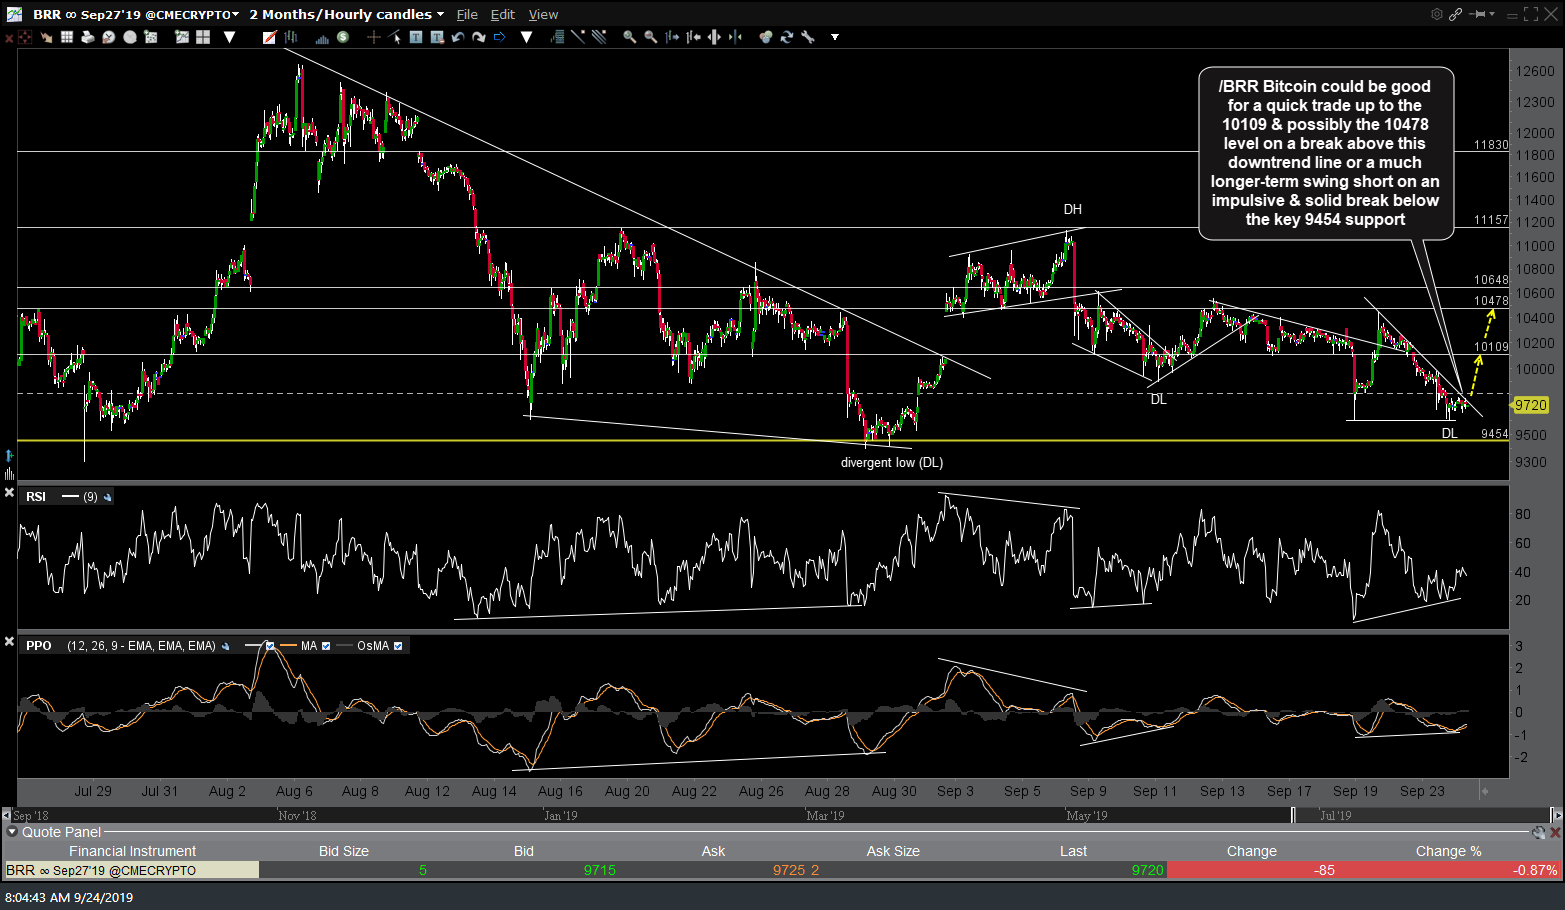
/BRR Bitcoin futures 60m Sept 24th
Should /BRR break out above the 60-minute downtrend line, GBTC is likely to run up to any or all of these potential price targets*/resistance levels while a solid break below 11.95 would be bearish. 60-minute chart below.
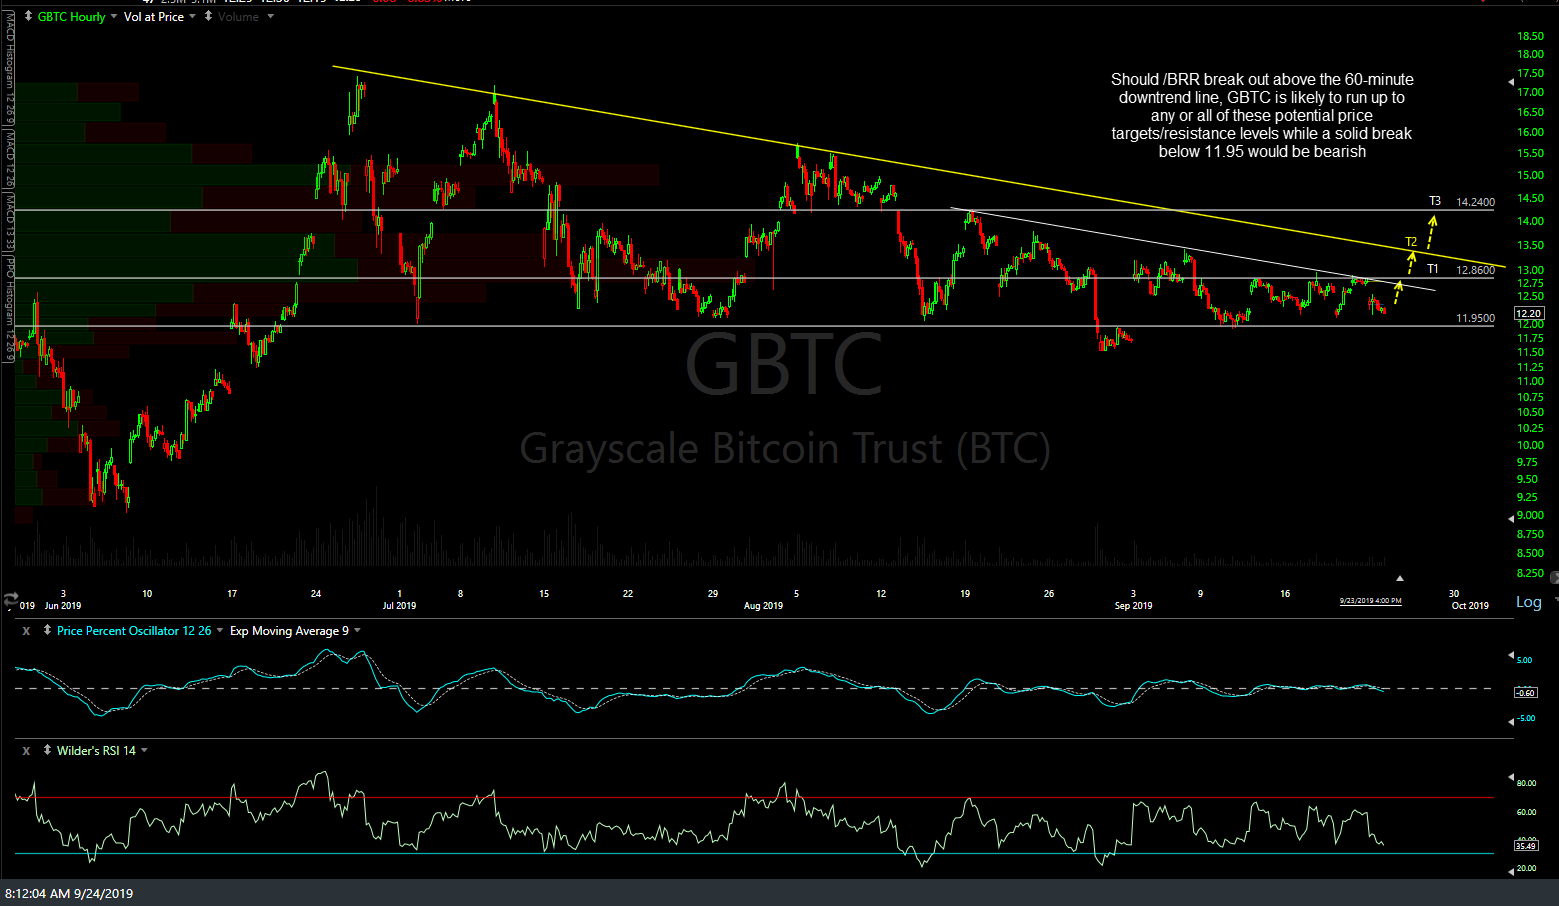
GBTC Bitcoin trust 60m Sept 24th
* As unofficial trade ideas, the price targets shown are the actual resistance levels where a reaction is likely, not adjusted price targets as provided with the official trades. Best to set your sell limit order(s) just shy of the resistance level(s) that you are targeting to help avoid missing a fill, should the sellers step in early.