
Member @double-r likes to trade the 3x leveraged ETFs of Russia (RUSS/RUSL) and China (YINN/YANG) and asked my opinion on the charts. As I prefer to use the 1x (non-leverage) ETF for analyzing the charts & determining my entries & exits when trading leveraged ETFs (as the decay from the leverage renders an distorted picture of where past interactions with buyers & sellers occurred) here is my daily chart & thoughts on FXI (iShares FTSE/Xinhua China 25 Fund ETF).
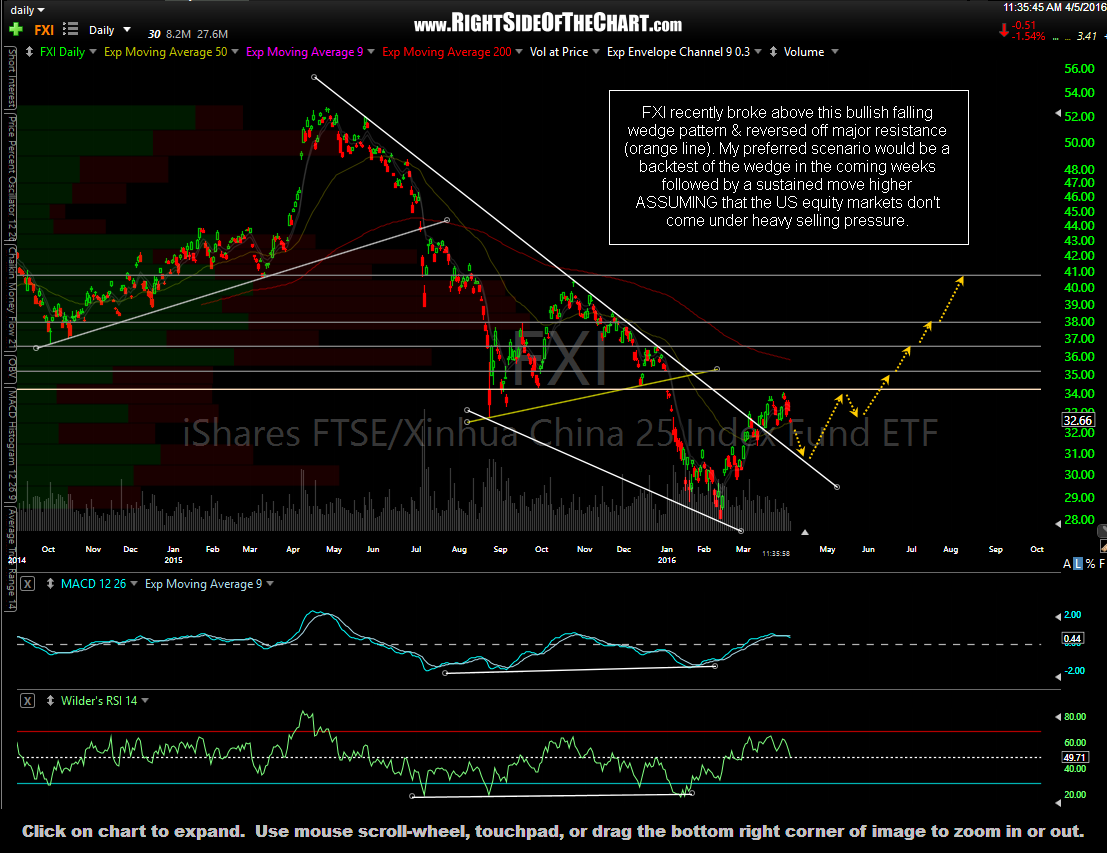
FXI daily April 5th
FXI recently broke above this bullish falling wedge pattern & reversed off major resistance (orange line). My preferred scenario would be a backtest of the wedge in the coming weeks followed by a sustained move higher ASSUMING that the US equity markets don’t come under heavy selling pressure. To be clear, my near-term read on FXI is not strong enough to warrant taking a position, long or short, at this time although I do believe that FXI is worth monitoring for a potential trade candidate in the coming weeks or months. The gray horizontal lines mark potential price targets/resistance levels, should FXI take out that key orange resistance level around the 34.30 level. RSX (Russia ETF) also looks to be setting up as a potential long-side trading opportunity, charts & comments to follow under a separate update.