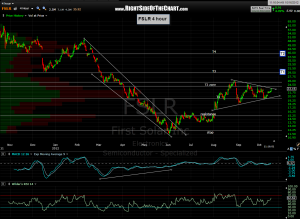
 here’s a 4 hour chart of the FSLR long setup that i mentioned below. i’d suggest waiting for a confirmed break above this symmetrical triangle pattern before entering a long position. this chart also contains the annotations from the last recent long trade, which i booked profits early on aug 7th as the trade was up 55% in just 3 weeks as i felt that it was just too much, too fast to warrant holding out for the higher targets without risking a pullback or lengthy consolidation.
since then, the stock has consolidated in this beautiful symmetrical triangle pattern and i believe that it might be time to move this one back to the front of the line in the trade setups category. the updated targets are stamped in blue (T1 & T2) and i will clean up this chart if FSLR breaks out and triggers and entry. my stop preference, again if triggered, is under 21.90.

