
FIZZ (National Beverage Corp) is on watch as an official short swing trade idea. Unlike most trade setups, which list the specific entry criteria when posted, I’m kicking around a couple of potential official entries right now but wanted to get these charts out in advance as it can take 15-20 minutes or more to analyze, annotate, screenshot & upload one or more charts on a trade plus the amount of time needed to compose the details on the trade before publishing the trade idea.
-
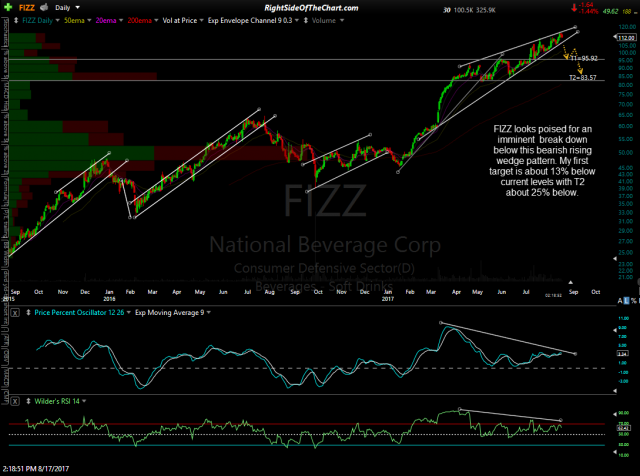
- FIZZ daily Aug 17th

-
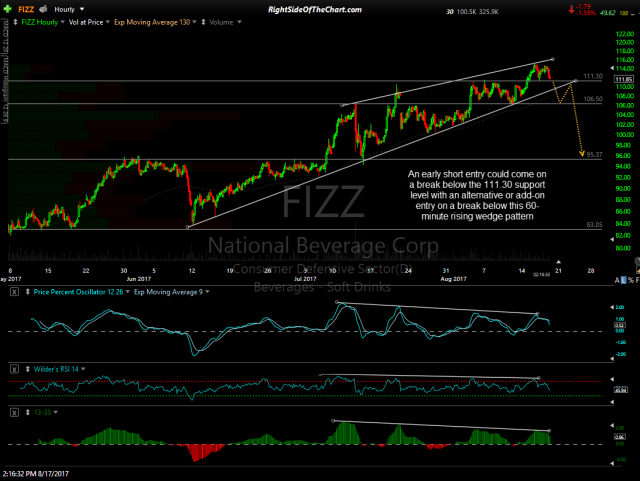
- FIZZ 60-min Aug 17th
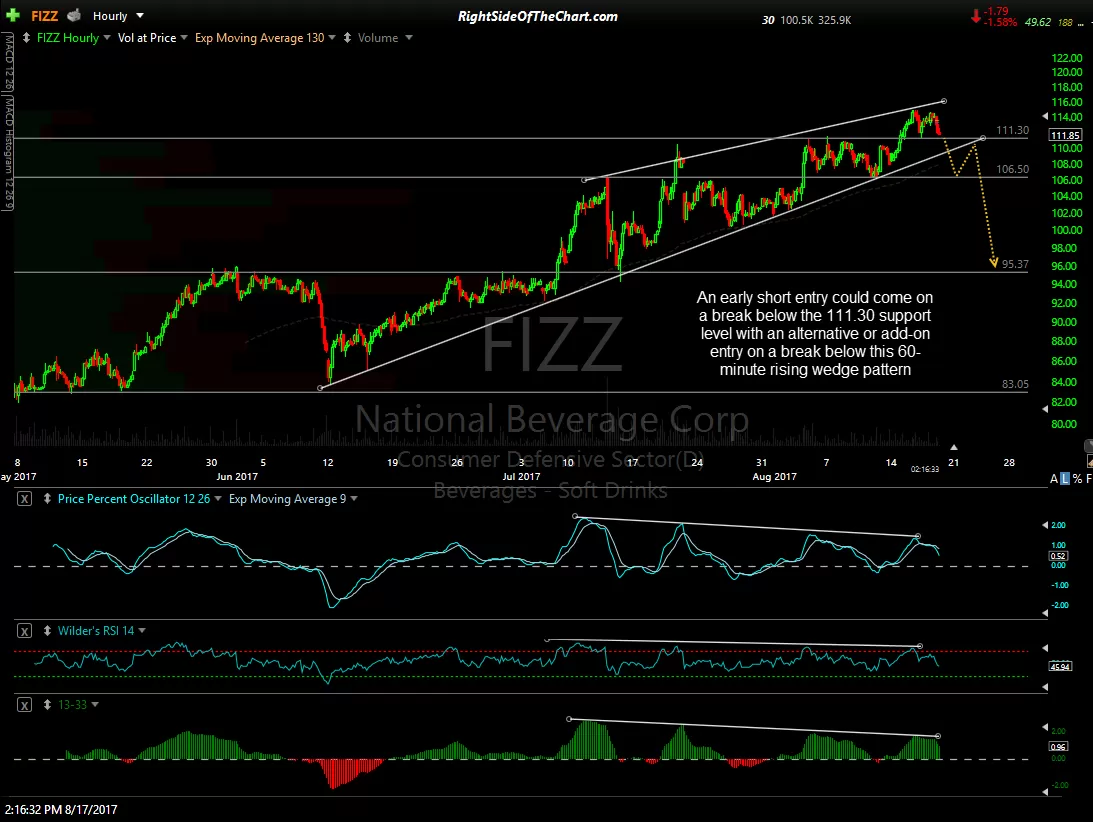
Essentially, FIZZ appears to have formed a fully mature & quite steep bearish rising wedge pattern on the daily time frame with the 60-minute charts also setting up in a smaller rising wedge pattern, the bearish nature of which is also confirmed via negative divergence just as with the wedge on the daily time frame.
I like to use the daily charts to identify a bullish or bearish chart pattern on a stock or ETF & then hone down on the entry as well as confirm or refute my analysis on the daily time frame by using the 60-minute charts. In this case, both charts are in alignment, indicating that a substantial trend reversal & correction is likely coming very soon on FIZZ. While the highest probability sell signal will come on an impulsive breakdown & a daily close below the rising wedge pattern on the daily chart, my confidence on an impending breakdown is high enough to start a short position before that occurs, either on a break below the 111.30 level (60-minute chart) and/or the uptrend line on the 60-minute chart.
Price targets are listed on the daily chart above with some of the nearby support levels on shown on the 60-minute chart. The suggested stop will depend on the specific entry price & the suggested beta-adjustment for this trade will be 0.90 with the official entry price to follow soon.