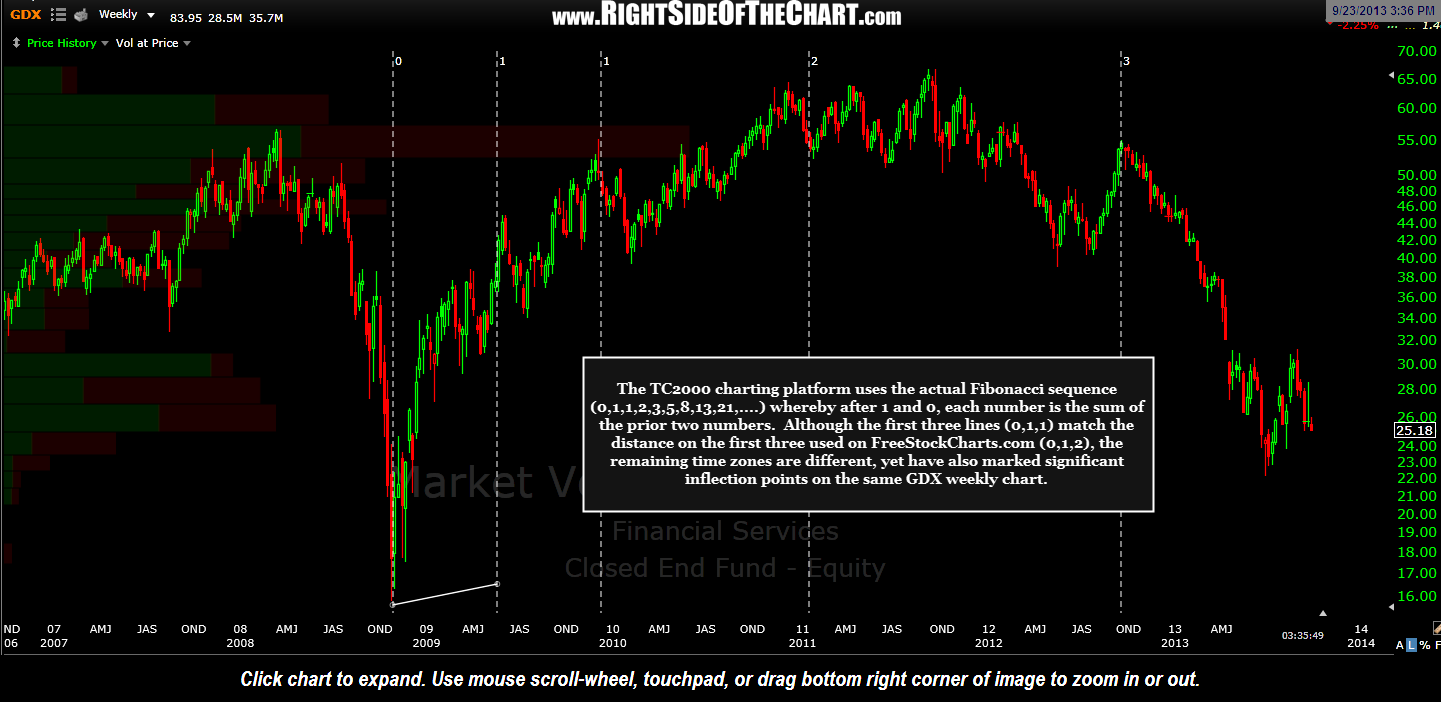
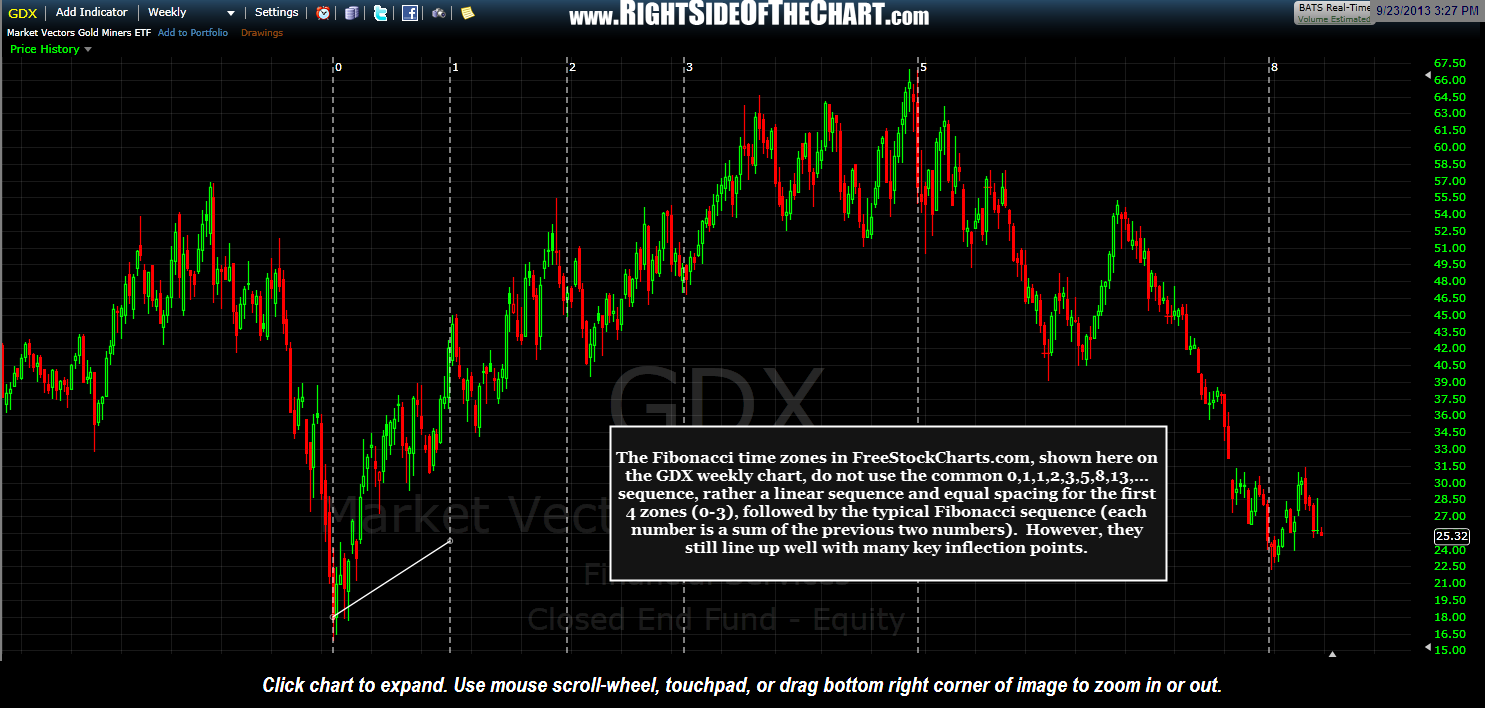
I received several responses to the chart posted earlier today showing the Fibonacci time zone cluster on the $SPX. One follower of the site shared how he successfully used Fib time zones with GDX on the weekly frame as I replicated on the chart below. Someone else had inquired why my chart showed the lines initial sequence of the time zone lines as 0,1,1,2,3 when on his chart the lines were sequenced as 0,1,2,3,5,8,…. I use various charting platforms but most of the charts that I post, including the one referenced in today’s previous post, are from the TC2000 platform, which is a subscription service from the same company that provides FreeStockCharts.com. Both are popular and very user-friendly charting platforms with the primary difference being a few more bells and whistles on the paid version. The weekly chart of GDX from TC2000 is below followed by the weekly chart of GDX from FreeStockCharts.com. Both use the Oct 2008 bottom in GDX as the starting point (“0″ line) with the second line set to the late May/early June 2009 reaction high (actually, just slightly before it as slight liberties/adjustments are often needed to match the best “fit” between the price of a security and the Fibonacci time sequence). The remaining lines are automatically set based on the predetermined sequence discussed below.
Variations of how Fib time zones are applied exist on different charting platforms. StockCharts.com, for example, uses fixed distance fib time zone lines whereby you can only place the beginning “zero” line and the remaining distances are pre-set while the TC2000/FSC.com Fibonacci Time Zone tool allows/requires you to drag the second line to any point on the chart that you want (typically a reaction low or high), thereby automatically re-spacing the remaining lines based on the Fibonacci sequence. StockCharts.com defines the Fibonnaci sequence as:
0, 1, 1, 2, 3, 5, 8, 13, 21, 34, 55, 89, 144, 233, 377, 610……
The sequence extends to infinity and contains many unique mathematical properties.
- After 0 and 1, each number is the sum of the two prior numbers (1+2=3, 2+3=5, 5+8=13 8+13=21 etc…).
- A number divided by the previous number approximates 1.618 (21/13=1.6153, 34/21=1.6190, 55/34=1.6176, 89/55=1.6181). The approximation nears 1.6180 as the numbers increase.
- A number divided by the next highest number approximates .6180 (13/21=.6190, 21/34=.6176, 34/55=.6181, 55/89=.6179 etc….). The approximation nears .6180 as the numbers increase. This is the basis for the 61.8% retracement.
As quite a few traders and investors who follow RSOTC use FreeStockCharts.com, I called Worden Brothers to inquire about the difference between the two platforms (FSC.com & TC2000) used in measuring these time zones. Nobody that I spoke could explain the reason for the discrepancy but they are looking into the issue for me but if/when they do contact me with the answer (or fix the issue), I will share their findings on the site. My primary reason for sharing this is to point out the discrepancy and avoid any confusion but also to share the fact that regardless of which sequence is used, both seem to have a useful application in predicting potential key inflection points in an index or individual security. Although the FreeStocksChart.com variation does not begin with the classic Fibonacci sequence listed above, it does provide some useful time symmetry using the first 4 lines (all measure equal distances in time), followed by the true Fib sequence (each number is a sum of the two previous numbers). I am far from an expert on the use of Fibonacci tools (arcs, fans, retracements, time zones, etc..) so maybe it is possible that both variations are used amongst mathematicians and chart technicians. I also wanted to reiterate that Fibonacci time zones & retracements are most useful when used to identify clusters (multiple Fib levels generated from various peaks and troughs coming together in close proximity) as well as when used in conjunction with other technical analysis tools (trendlines, price support & resistance, moving averages, divergences, etc…).


