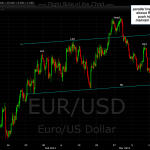
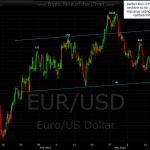
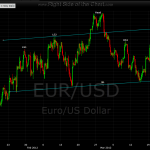
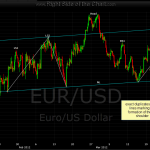
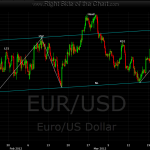
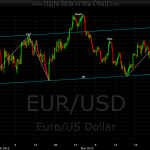
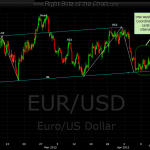
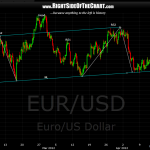
the H&S pattern that i’ve been tracking on the EUR/USD 4 hour time frame has now broken below the neckline, officially triggering the pattern. i would be surprised NOT to see the central banks set in to foil what, at this point, is probably a very closely watched technical pattern. however, until proven otherwise (reversed) a breakdown is a breakdown and this technical breakdown in the EUR/USD currency pair only further strengthens my primary scenario for the US stock market, which is more downside to come.
continue to remain nimble, use appropriate stops on your trades and above all else; expect the unexpected (although gov’t intervention is actually the NORM these days, vs. the unexpected). of course, we’ve seen massive and even widely publicized gov’t intervention at nearly every critical technical juncture in the market since the 2008 melt-down but one day the “surprise” will be either that the calvary does not come riding in to the rescue or that maybe they do but they’ve finally fired their last bullet and market forces take over… but i digress….
for now, as the technical evidence suggests, the chart favor more downside, at least in the near-term so consider tightening up stops on any remaining longs and/or booking some profits if you have them. remember as well that the currency markets are more easily and directly manipulated by the central banks so personally, i put more stock (no pun intended) in the technicals of the equity markets (SPX, NDX, etc..) and mainly used the currency charts to help confirm or refute what i am seeing on the equity indexes. for reference, here are the 4-hr EUR/USD charts in order from most recent to the original showing the formation of this pattern (or just click on the first chart if you’ve already been following this pattern).


