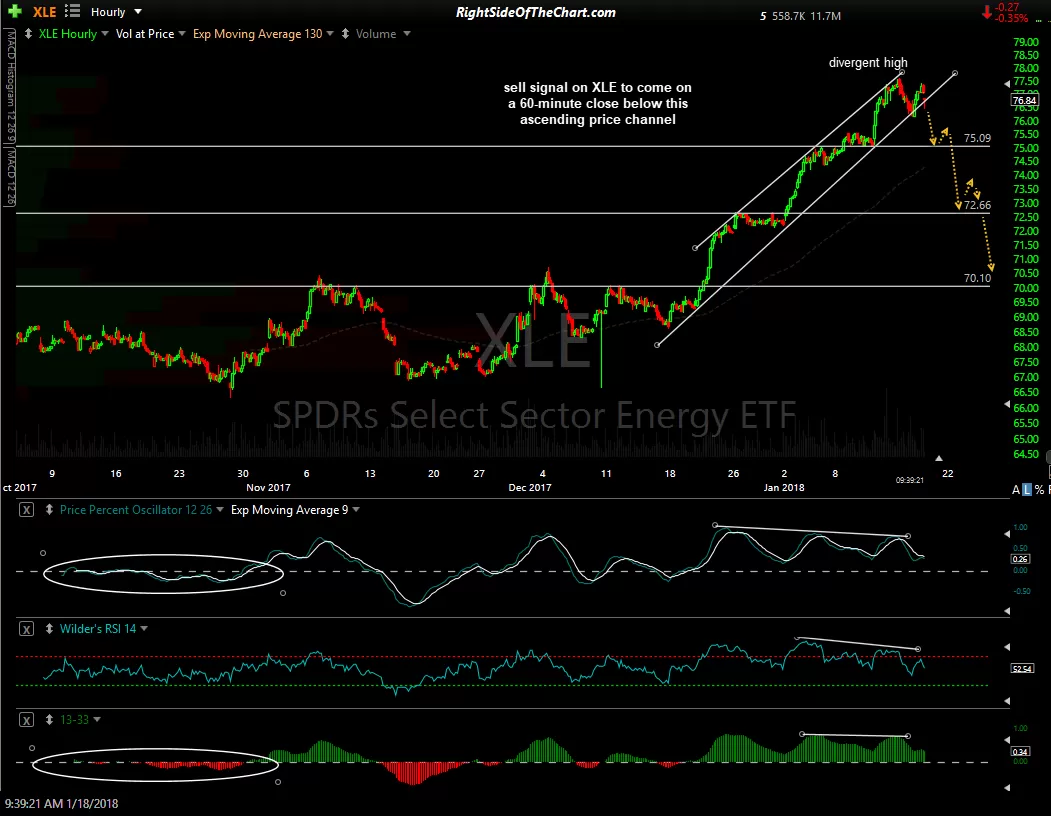
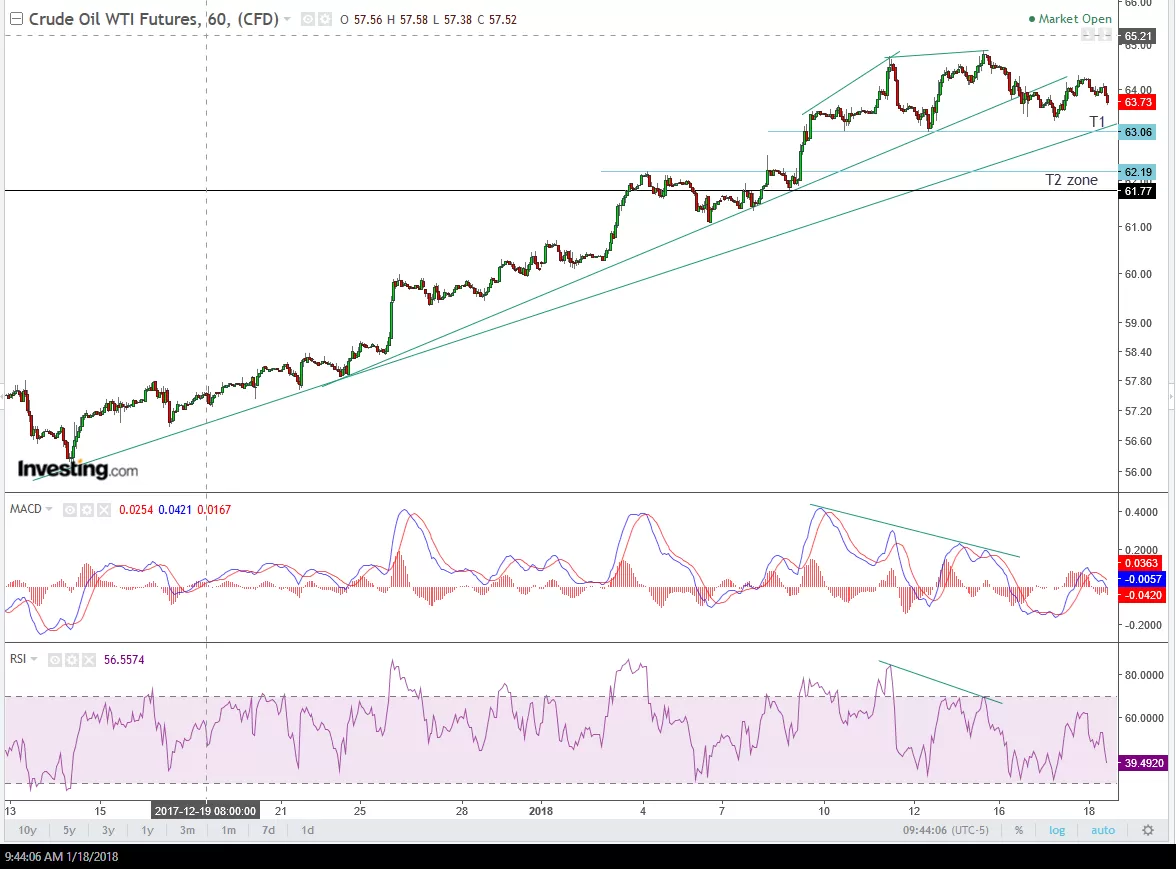
Two of the three (XES & XOP) of the major oil & gas ETFs that I closely monitor have triggered sell signals on the 60-minute time frame with XLE poised to follow suit. My expectation for a pullback in the energy stocks meshes with my expectation for a correction in crude oil prices & the EIA Petroleum Status Report, scheduled to be released at 11:00am ET, could be the catalyst for a move down to the price targets that I’ve recently highlighted on the 60-minute chart of /CL (crude futures) below. The other three charts are the 60-minute charts of XLE (SPDRs Select Sector Energy ETF), XOP (SPDRs S&P Oil & Gas Exploratation & Production ETF) and XES (SPDRs S&P Oil & Gas Equipment & Services ETF).
click on first chart to expand, then click anywhere on the right of each expanded chart to advance to the next chart.
-
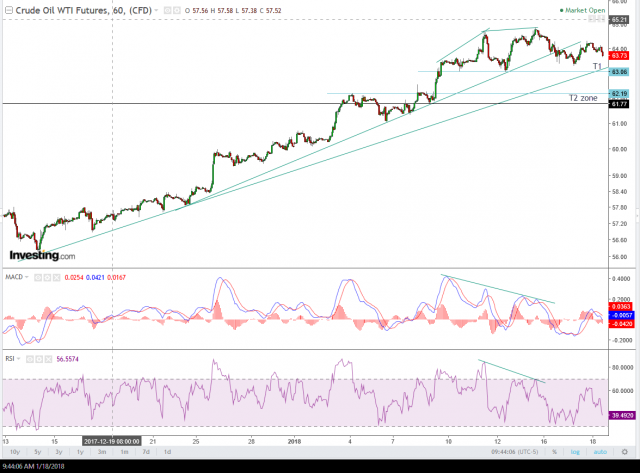
- CL 60-min Jan 18th
-
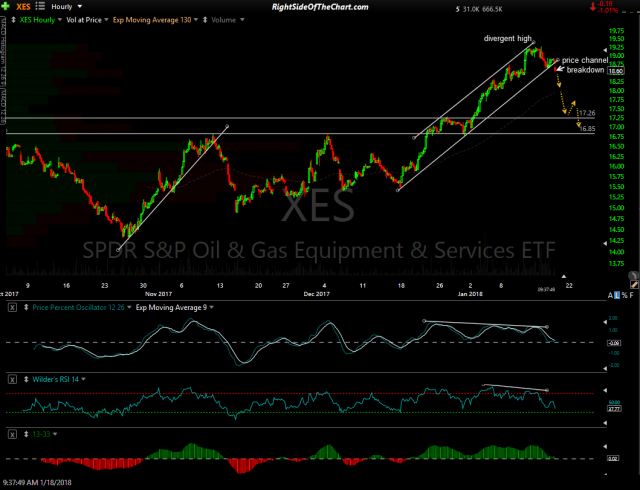
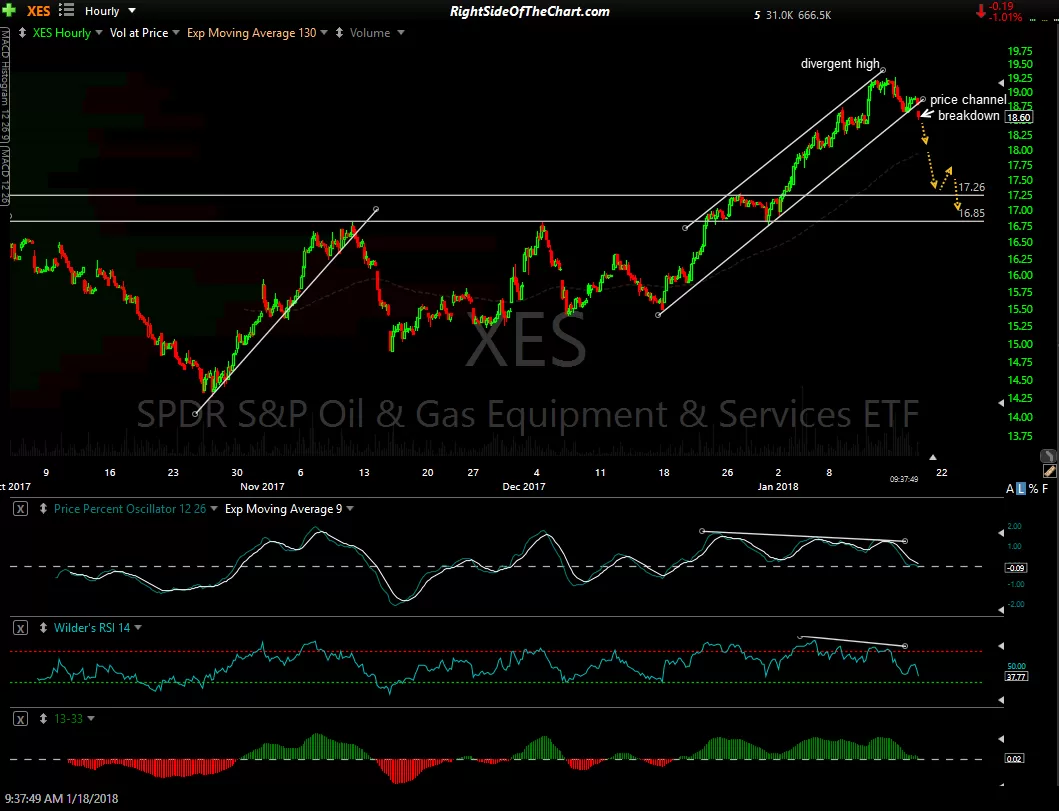
- XES 60-min Jan 18th
-
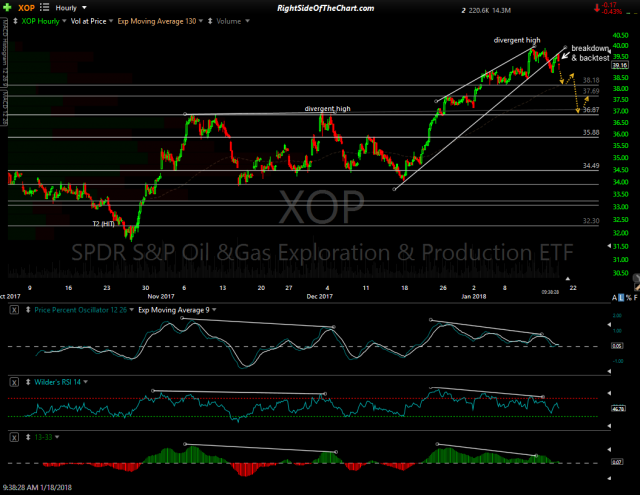
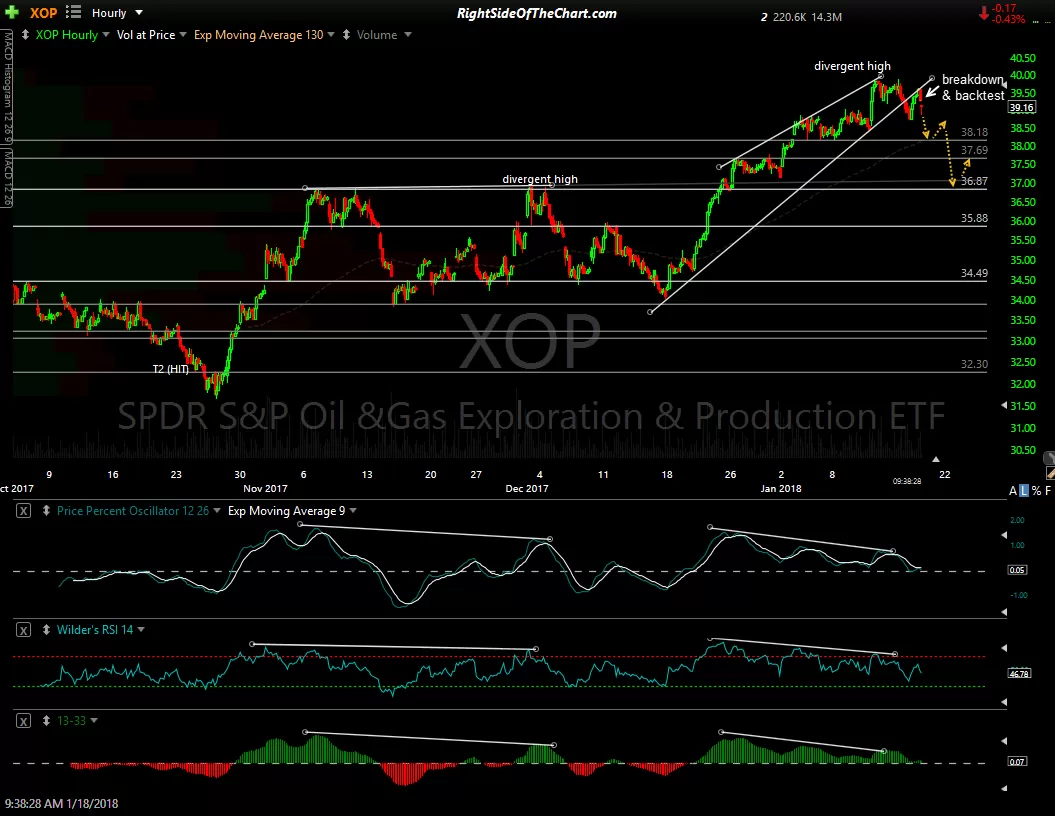
- XOP 60-min Jan 18th
-
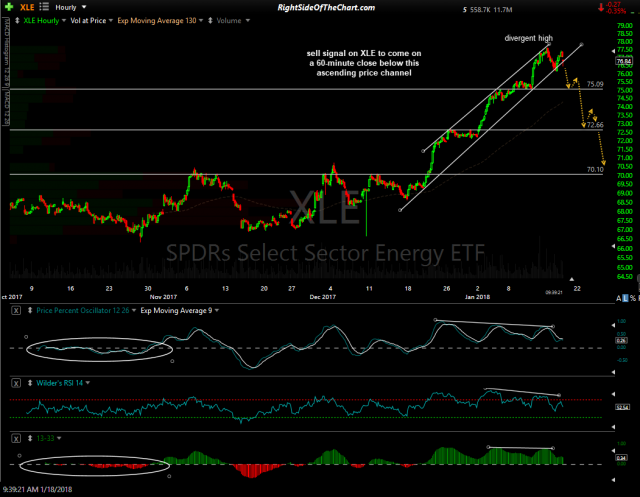
- XLE 60-min Jan 18th