
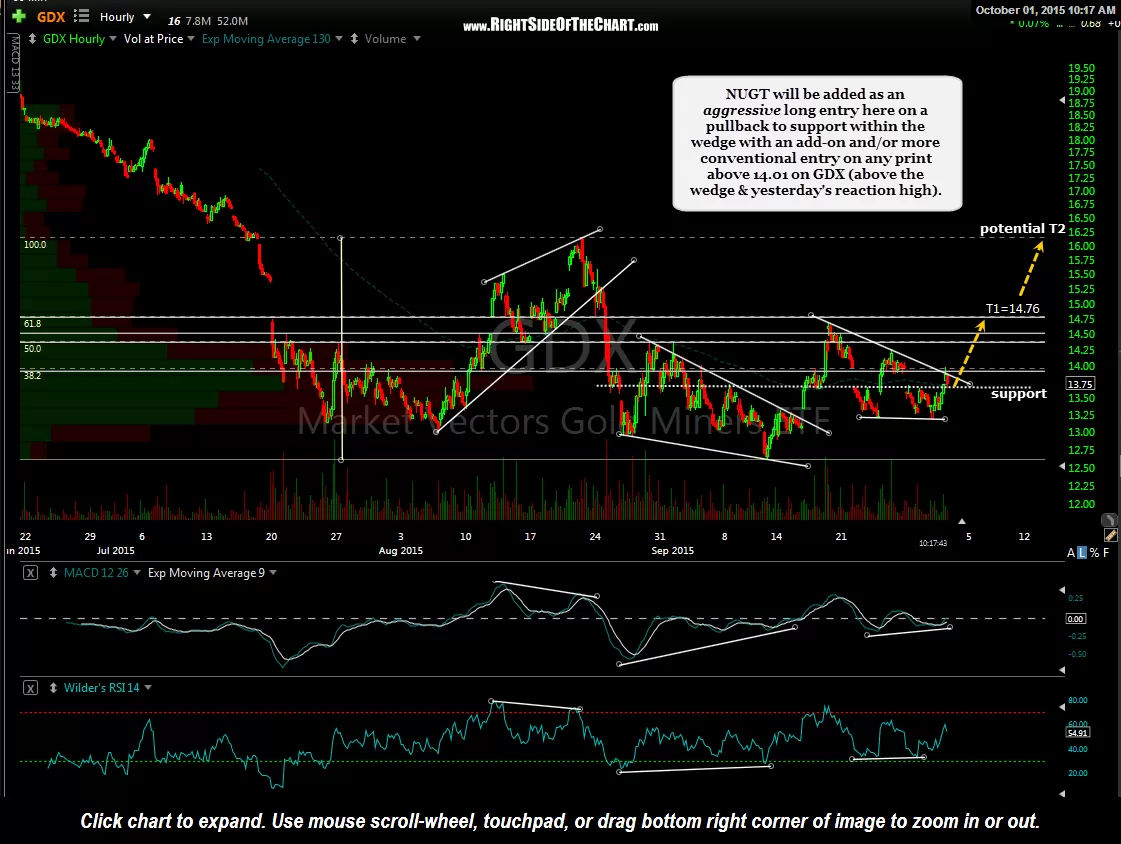
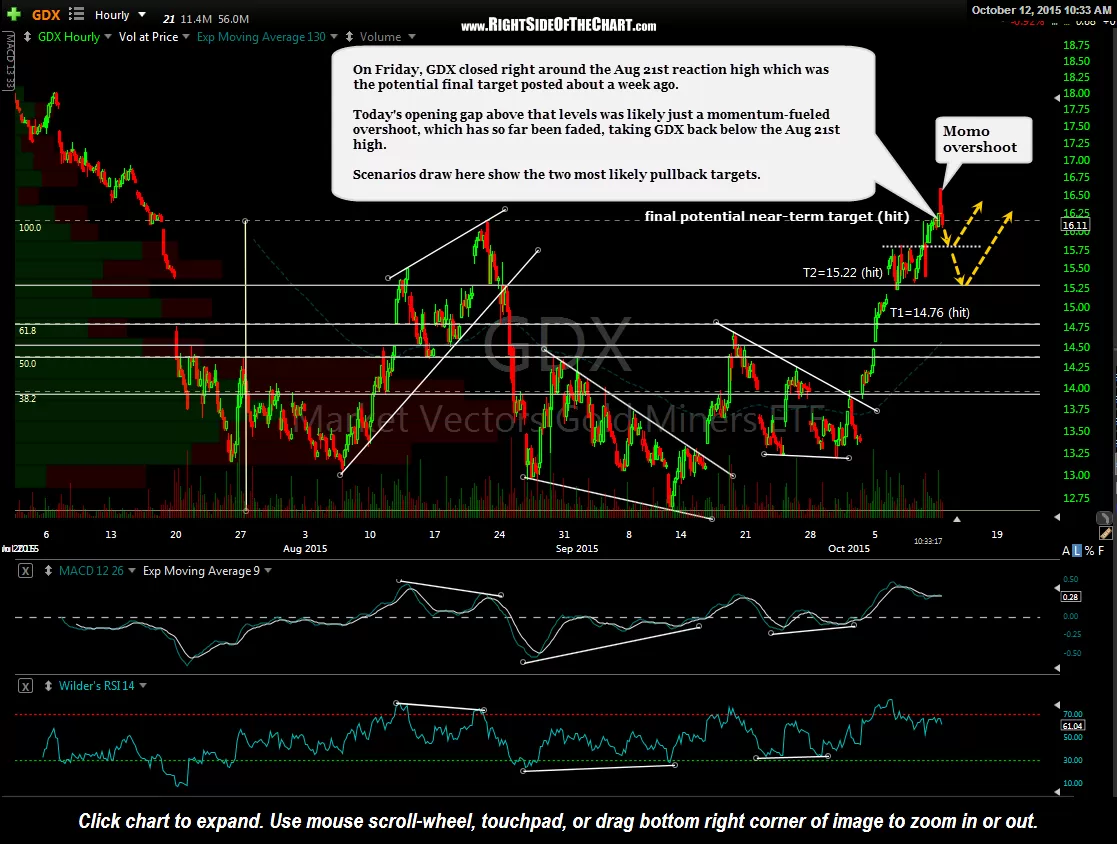
It’s been a nice run off of the Sept 30th lows in the gold mining stocks with GDX ripping about 27% in just over two weeks. Although the official NUGT long trade entered on Oct 1st (1st chart below) was closed out at last week in order to book the quick gains, GDX continued higher to my original final but unofficial price target & pulled back, as per the last update on Monday (2nd chart below), reversing slightly below the more shallow of those two pullback targets, going on to make a marginal new high around yesterday and GDX is once again challenging that high as I type.
-

- GDX 60 minute Oct 1st
-

- GDX 60 minute Oct 12th
-
- GDX 60 minute Oct 15th
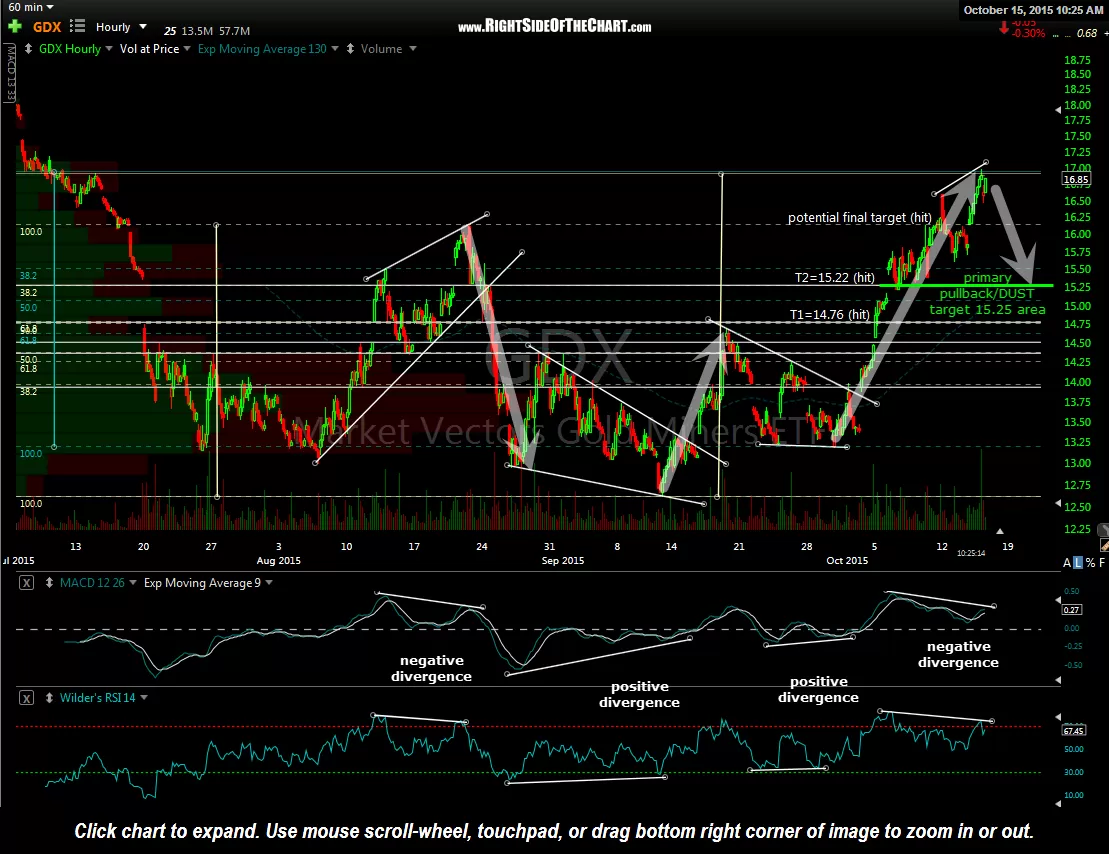
The third chart above is the updated GDX 60-minute chart showing my reasoning for reversing from a long position in the miners (I sold some Nov GDX calls yesterday & the last of my position, Dec calls, just before composing this post) to a short position via DUST (3x short gold miners ETF). My current sole price target for a pullback is just above the 15.25 support level in GDX, with a price target of 16.30 in DUST (subject to modification depending on how well it tracks GDX in the next couple of weeks). DUST will be added as an Active Trade at current levels (trading at 11.88 right now) with that sole price target (at this time) of 16.30 and a suggested stop on any print at or below 10.40. I chose a DUST long vs. a NUGT short this time around as I believe any correction in GDX is likely to be relatively swift.
Remember, as the charts are dynamic, so is trading plan at times, especially when trading the fast-moving mining stocks. This 60-minute chart of DUST below shows 3 additional resistance levels (comparable to support levels on GDX/NUGT) in which I may decide to book partial or even full profits, assuming that this anticipatory trade starts to play out as expected. Anticipatory means that I have zero sell signals on the miners, in fact, they are in one of the most powerful uptrends in years and still trading at the highs of that uptrend to boot. More conventional traders might prefer to wait for a breakout of the bullish falling wedge pattern shown on this DUST chart (a comparable bullish rising wedge can be drawn on GDX) or a solid break above the 12.80 level on DUST, which would give the trade a slightly better chance of playing out, albeit at a less favorable entry price.
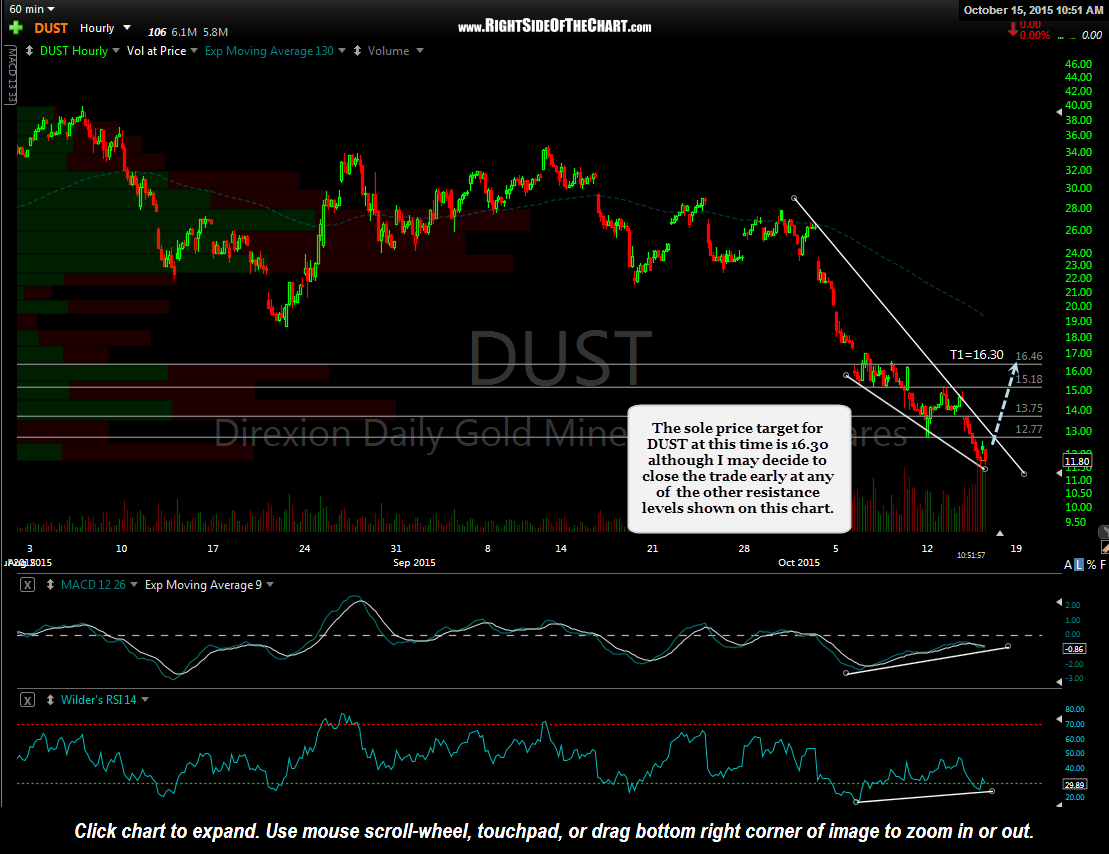
DUST 60 minute Oct 15th