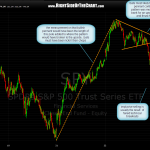
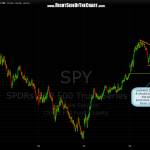
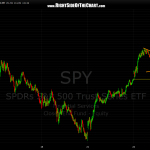
as mentioned yesterday, we usually see very impulsive selling following the failure of a bullish pattern to play out as expected or even worse, a bullish technical breakdown that fails shortly after triggering (which i’ll cover in the next post with the 60 minute charts). here’s the updated SPY 3 minute chart showing that very clean, very promising looking bullish pennant which undoubtedly had quite a few bulls salivating and most likely adding to their longs in anticipation of the breakout. the problem is, and this cuts both ways with bears trying to short during uptrends too, is that so many traders are near-sighted and tend to focus only on the intraday charts pattern. in this case, we did have some recent bullish technical action on the 60 minute frames (which i will cover next) but the bigger picture remains that the current trends, both short-term and intermediate-term remain lower in addition to the weekly and even monthly charts both looking much more bearish than bullish. my point is that although some short-term bullish patterns can & sometimes will play out in a downtrend, and yes… eventually one of them will eventually mark the beginning of a new uptrend, more often than not, short-term (intraday) bullish technical patterns will far short of the projected price target and often fail just after breaking out, if they even break out at all. the same holds true for shorting during an uptrend as well. here are the string of those 3 minute charts on the SPY (the other indices look pretty much the same).
Results for {phrase} ({results_count} of {results_count_total})
Displaying {results_count} results of {results_count_total}


