
Member @murphydoc requested an opinion on CVS (CVS Health Corporation) in the trading room & as a meaningful reversal & rally in the stock appears to be close at hand, CVS will be posted as a both a Long Swing Trade Setup as well as a Growth & Income Trade setup (descriptions of each trade category can be found at the top of each trade category located under Trade Ideas on the menu bar).
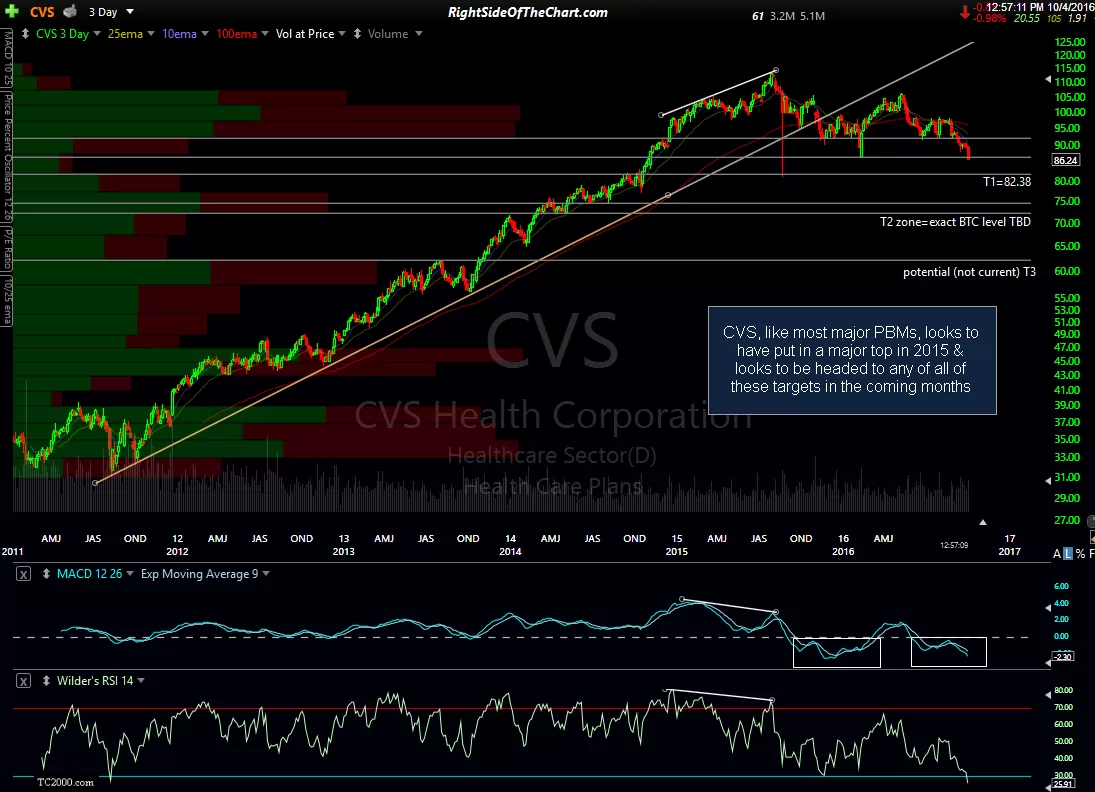
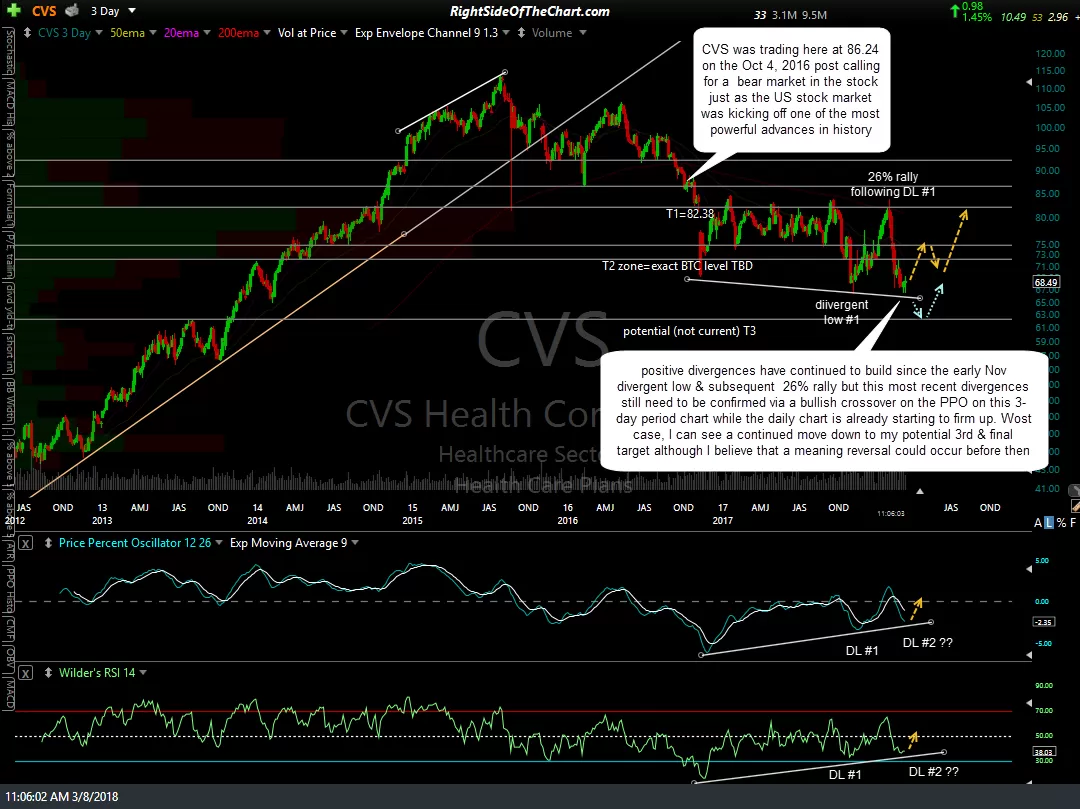
CVS appears to have come full circle since the first chart below was posted in the Oct 4, 2016 post- Pharmacy Benefit Managers Poised for a New Bear Market. That was a 6-year, 3-day period chart with each candle representing 3 days of trading history. As the following 3-day period chart shows, CVS went on to hit both of my two price targets (T1 & T2) while falling about 22% since then (meeting the standard bear market definition of a drop of 20% or more) while starting to approach my potential, but still not current, third & final target. That was also just before the US stock market kicked-off one of the most powerful & lasting rallies in history, starting with the Trump-pump after the Nov 2016 elections… a great example of how there are always attractive shorting opps in a bull market just as there are plenty of long-side trading opps during a bear market.
click on first chart to expand, then click on right to advance to the next expanded chart
-

- CVS 3-day period 6-yr Oct 4th
-

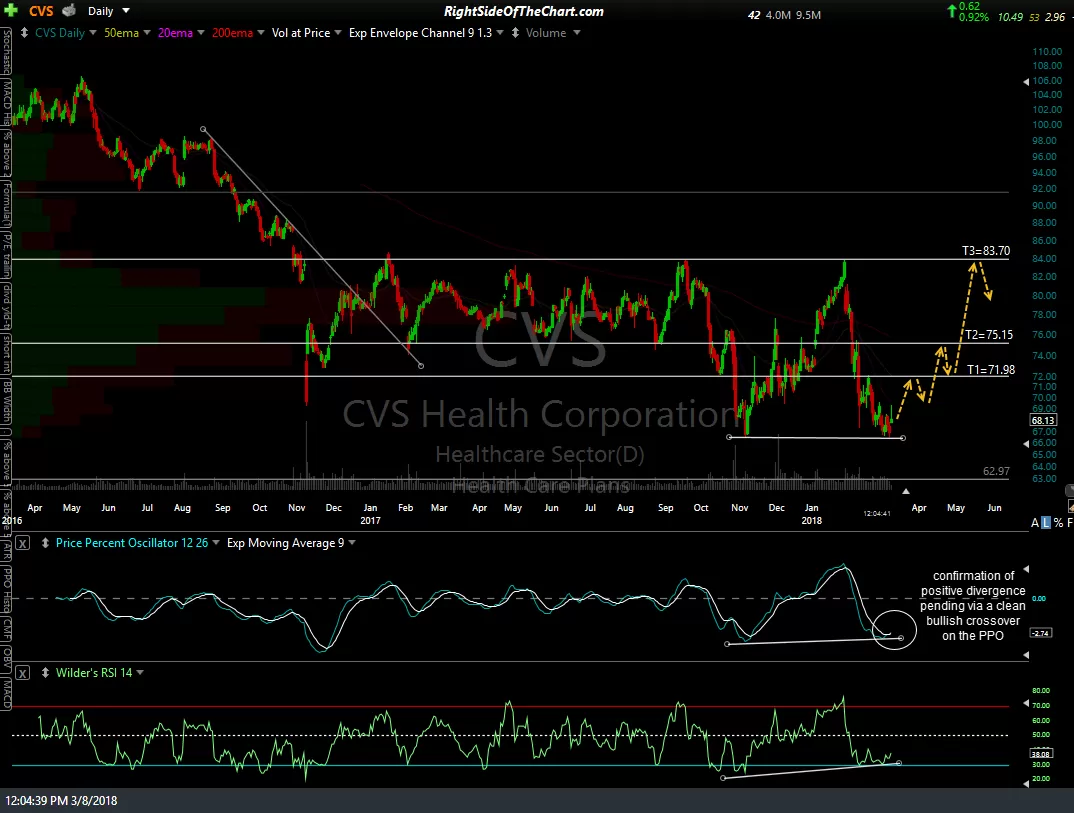
- CVS 3-day period 6-yr 3-8-18
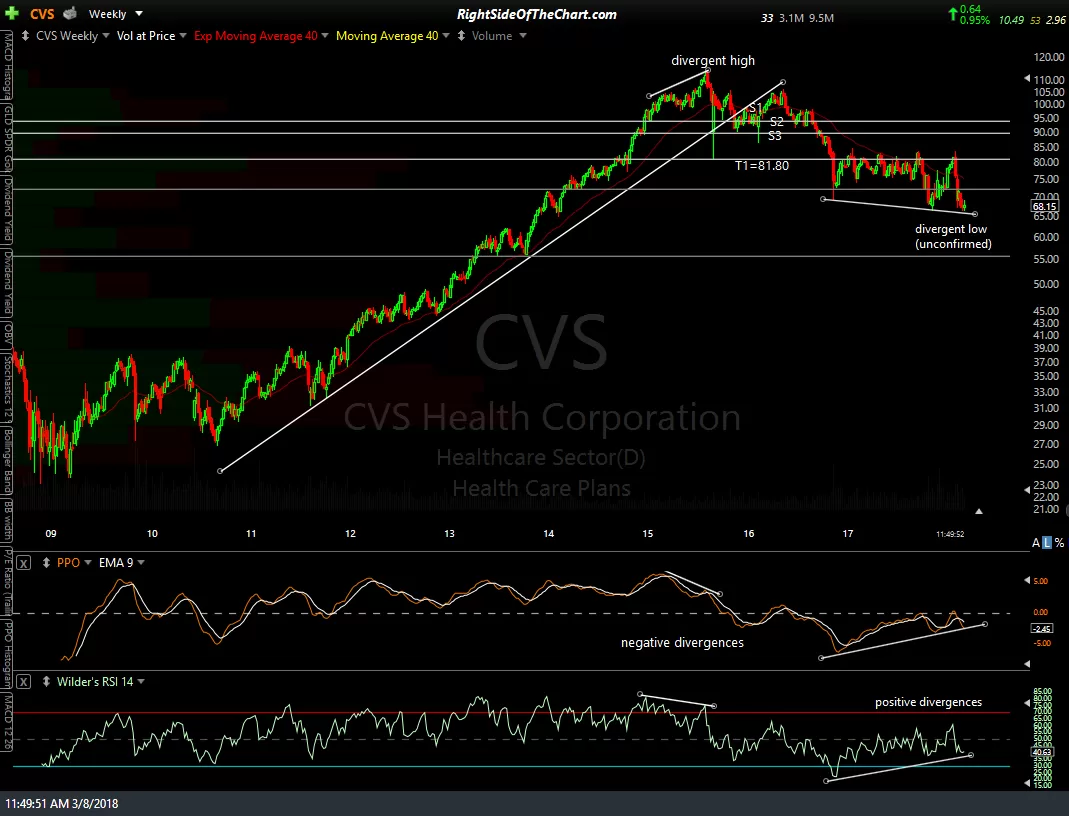
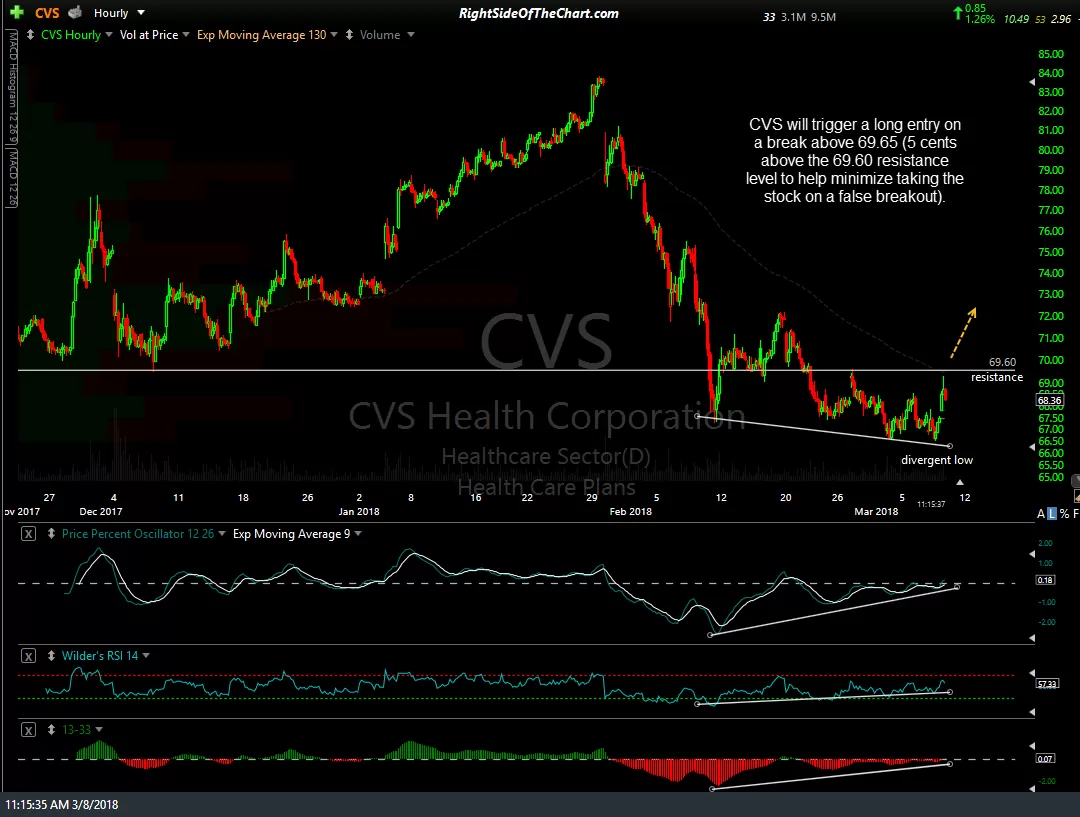
At this time, we have what I like to refer to as potential but unconfirmed positive divergences on the weekly time frame. I refer to positive divergence as unconfirmed until & unless the PPO turns back up & makes a bullish crossover while putting in a lower low via the most recent trough on the PPO. Otherwise, potential divergences can be “negated”, should the PPO continue lower & move down below the previous lows on that momentum indicator. As such, this is a trade setup only at this time, not an Active Trade. As the stock will have soon have the bullish divergences on the daily time frame confirmed if it moves much higher from here, CVS will trigger a long entry on a break above 69.65, which is 5 cents above the 69.60 resistance level to help minimize taking the stock on a false breakout (see 60-minute chart below).
-
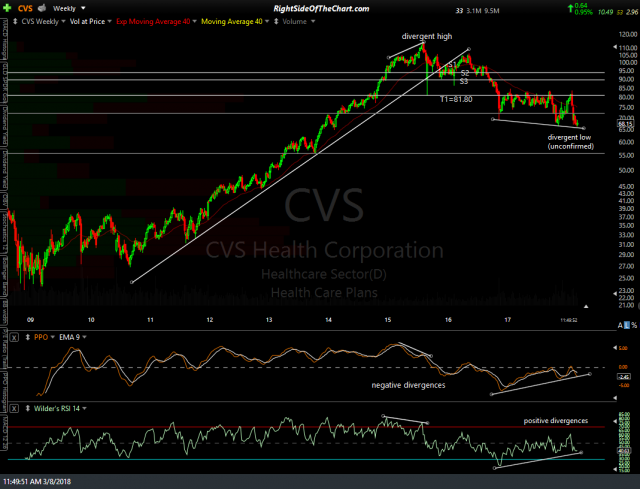
- CVS weekly March 8th
-

- CVS daily March 8th
-
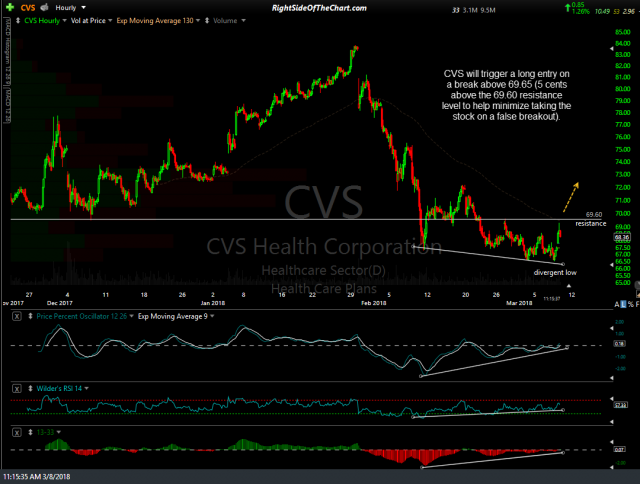
- CVS 60-min March 8th
Should a long entry be triggered on a break above 69.65 (i.e.- any print of 69.66), the price targets for this trade will be T1 at 71.98, T2 at 75.15 & T3 at 83.70. The maximum suggested stop will be any move below 62.97 if targeting T3 with a higher stop suggested if only targeting T1 or T2. The suggested beta-adjusted position size for this trade is 0.90.
(tip: hover over any text with a dotted underline, such as beta-adjusted position size, for a pop-up description of that word or term).