
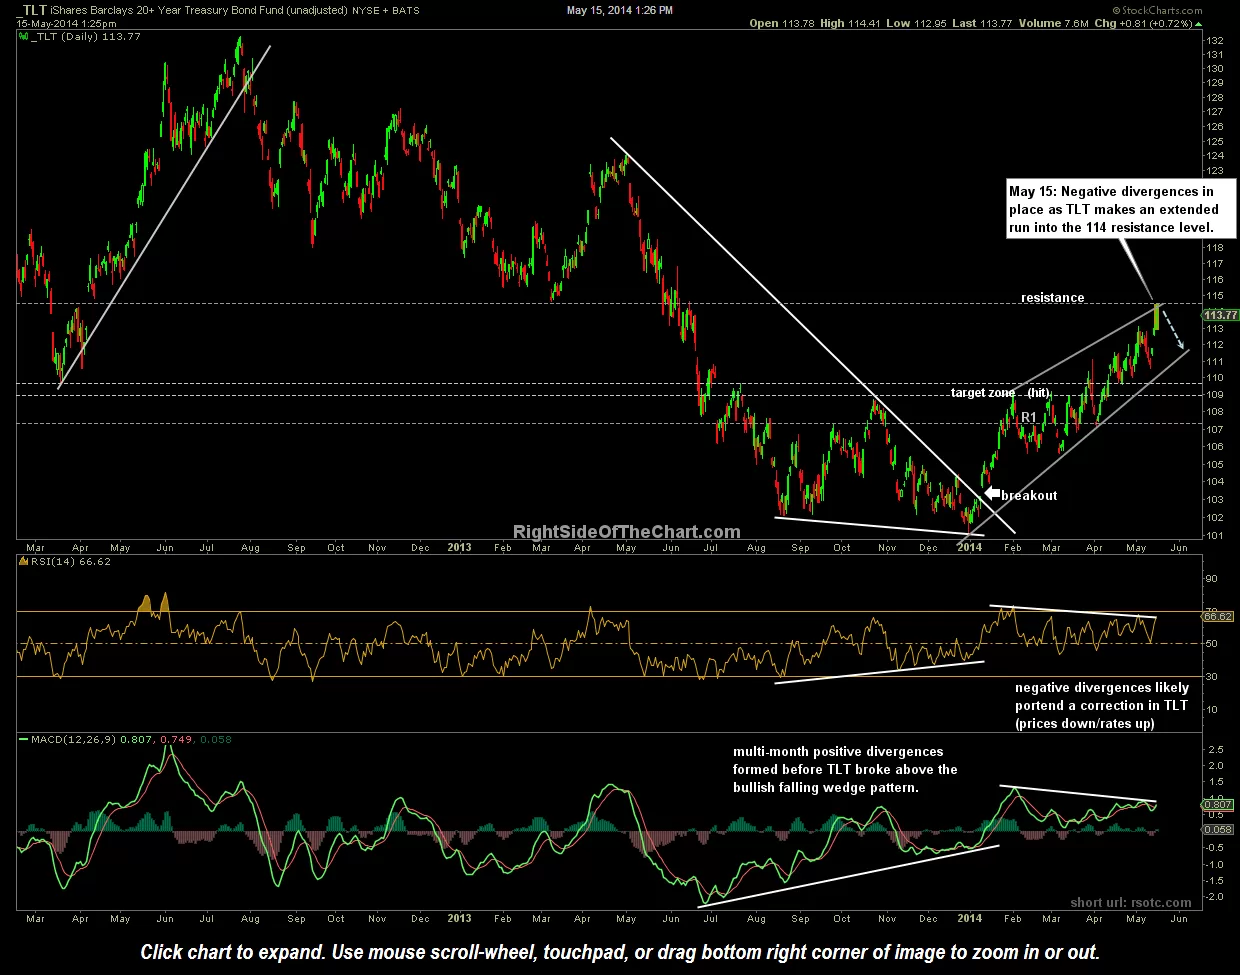
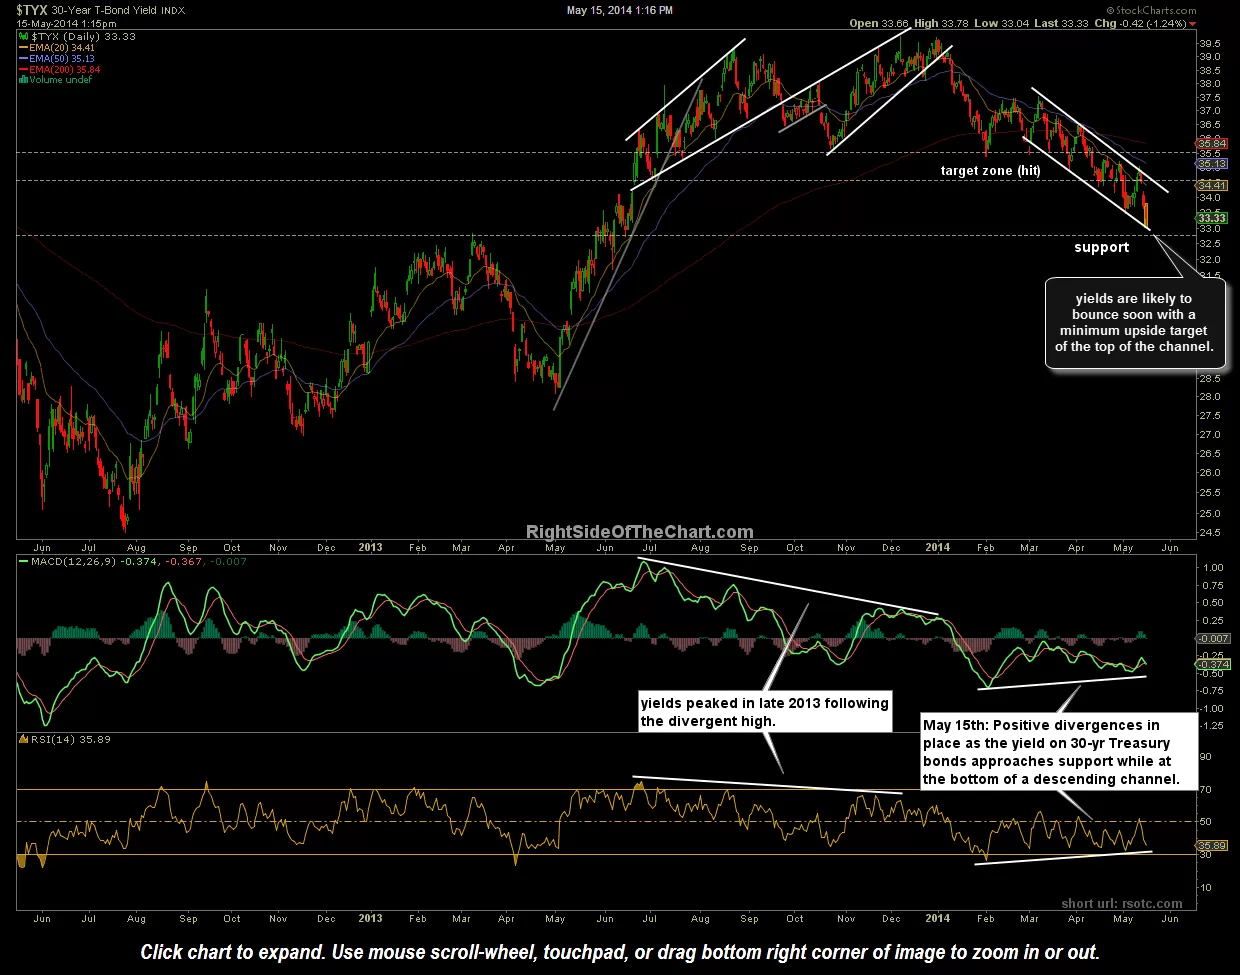
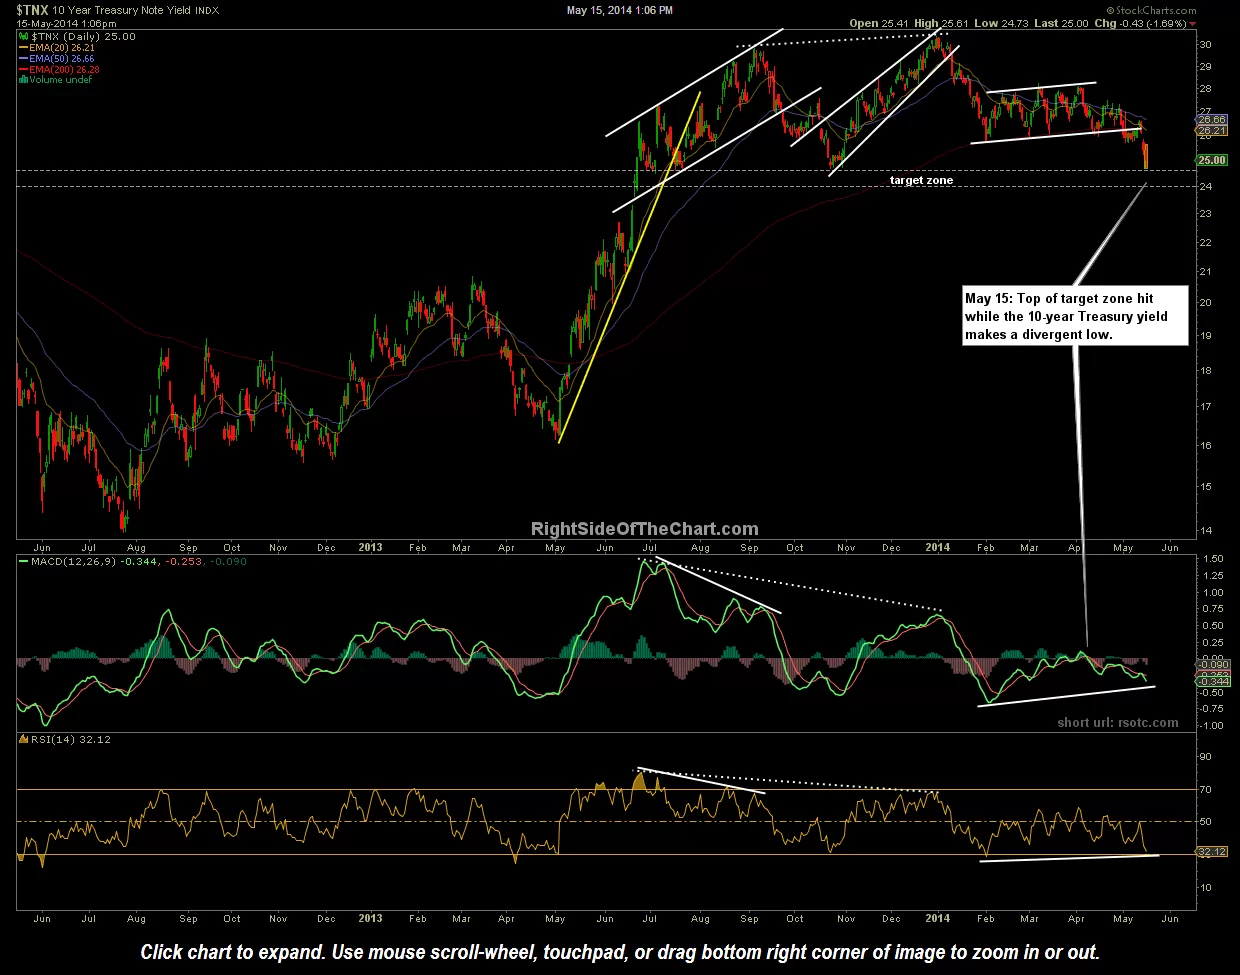
Long-dated treasury bond yields (10-30 year) have been in a downtrend that kicked off on the first trading day of 2014. Based on my interpretation of the charts below, that trend has likely run its course, at least in the near-term as the odds for a correction (bond prices down/rates up) are quite elevated at this time. The first chart is the daily chart of the TLT (20+ year Treasury Bond ETF) while the following charts are the 10-year Treasury Yield Index ($TNX) and the 30-year Treasury Yield Index ($TYX). Links to the live, updated versions of these charts, as well as other fixed income securities, are available from the Live Charts page. Although high-yield (junk) bonds have a low, often inverse correlation to treasury bonds, I’ve included a chart of JNK (High-yield bond etf) as it is also poised for a likely correction following the recent divergent high and overbought readings.
-

- TLT daily May 15th
-

- $TYX daily May 15th
-

- $TNX daily May 15th
-
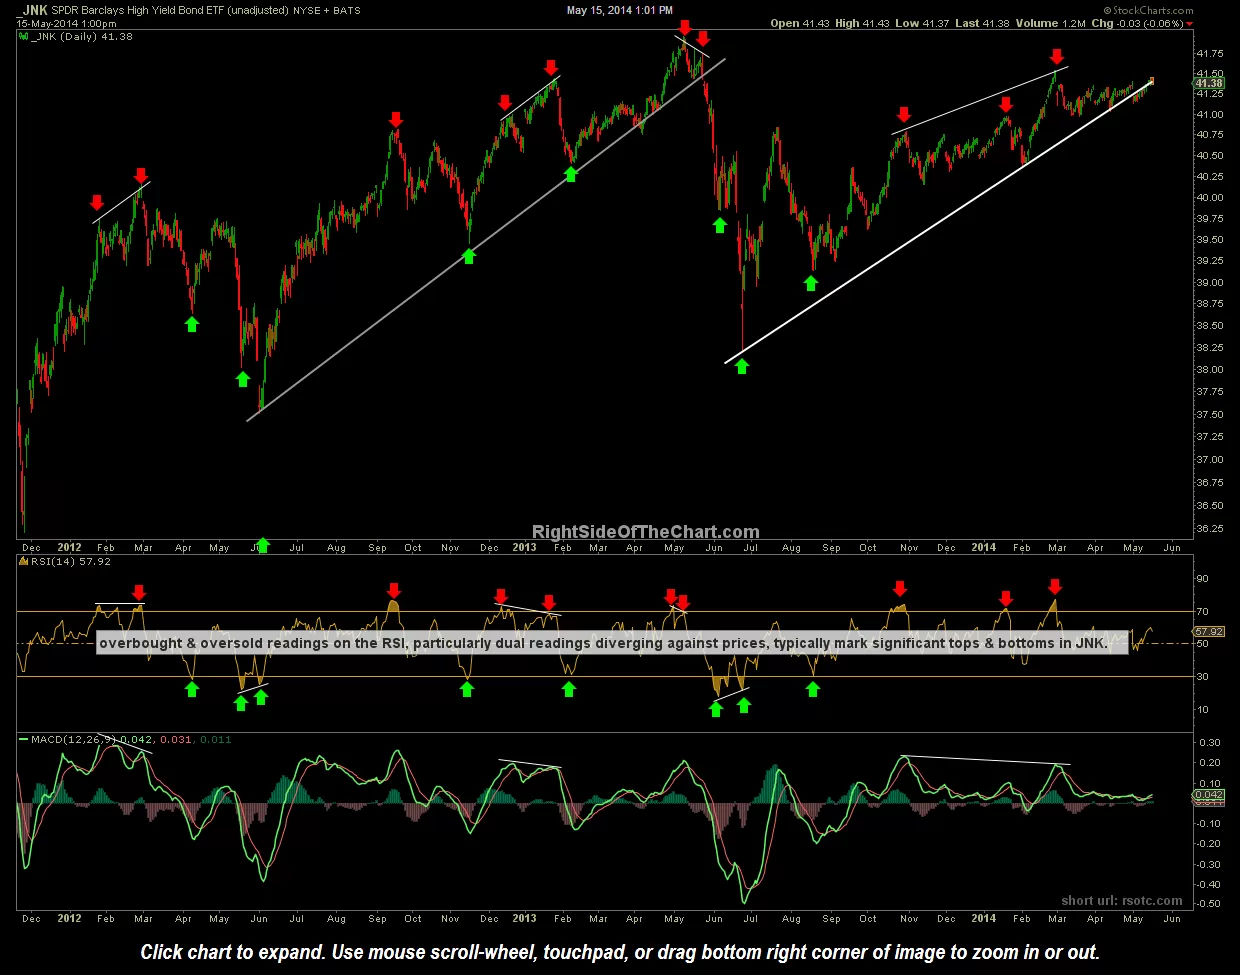
- JNK daily May 15th
Numerous ETFs exist for trading treasuries both long and short, leveraged & non-leveraged such as TLT, TBT, UST, IEF, TBF and many more. Keep in mind that leveraged ETFs are prone to price decay over time which makes these instruments best used for day trades or short-term swing trades. I typically avoid trading the 3x leveraged ETF other than day trades or occasionally swing trades on the short side, in order to attempt to capture both the expected price move of the underlying index or sector as well as the inherent price decay due to the leverage.