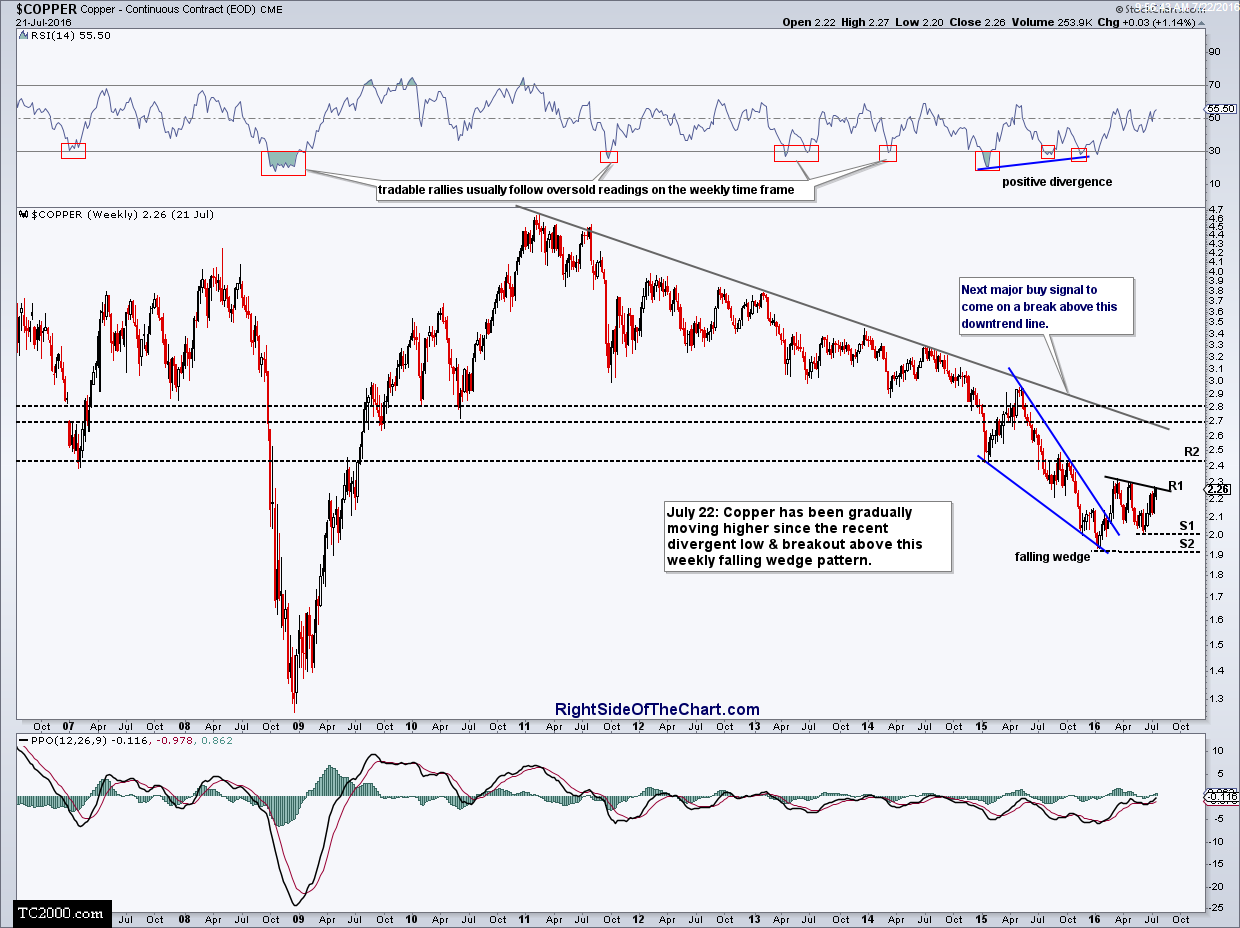
I had a request from member @vim2 for an update on copper. Here’s my 10 year weekly chart of $COPPER (spot copper prices). Copper has been gradually moving higher since putting in a divergent low around the beginning of the year & breaking out above this bullish falling wedge pattern shortly afterwards. Prices are currently up against a minor downtrend line (R1) which a move up to the R2 level (2.44ish) quite likely if R1 is taken out. Should copper fail to take out the downtrend line resistance at this time, look for any pullbacks to be contained at either S1 (2.00) or S2 (1.90ish) in order to keep the longer-term bullish outlook intact.
Copper Threatening Breakout Above Resistance
Share this! (member restricted content requires registration)
4 Comments


