
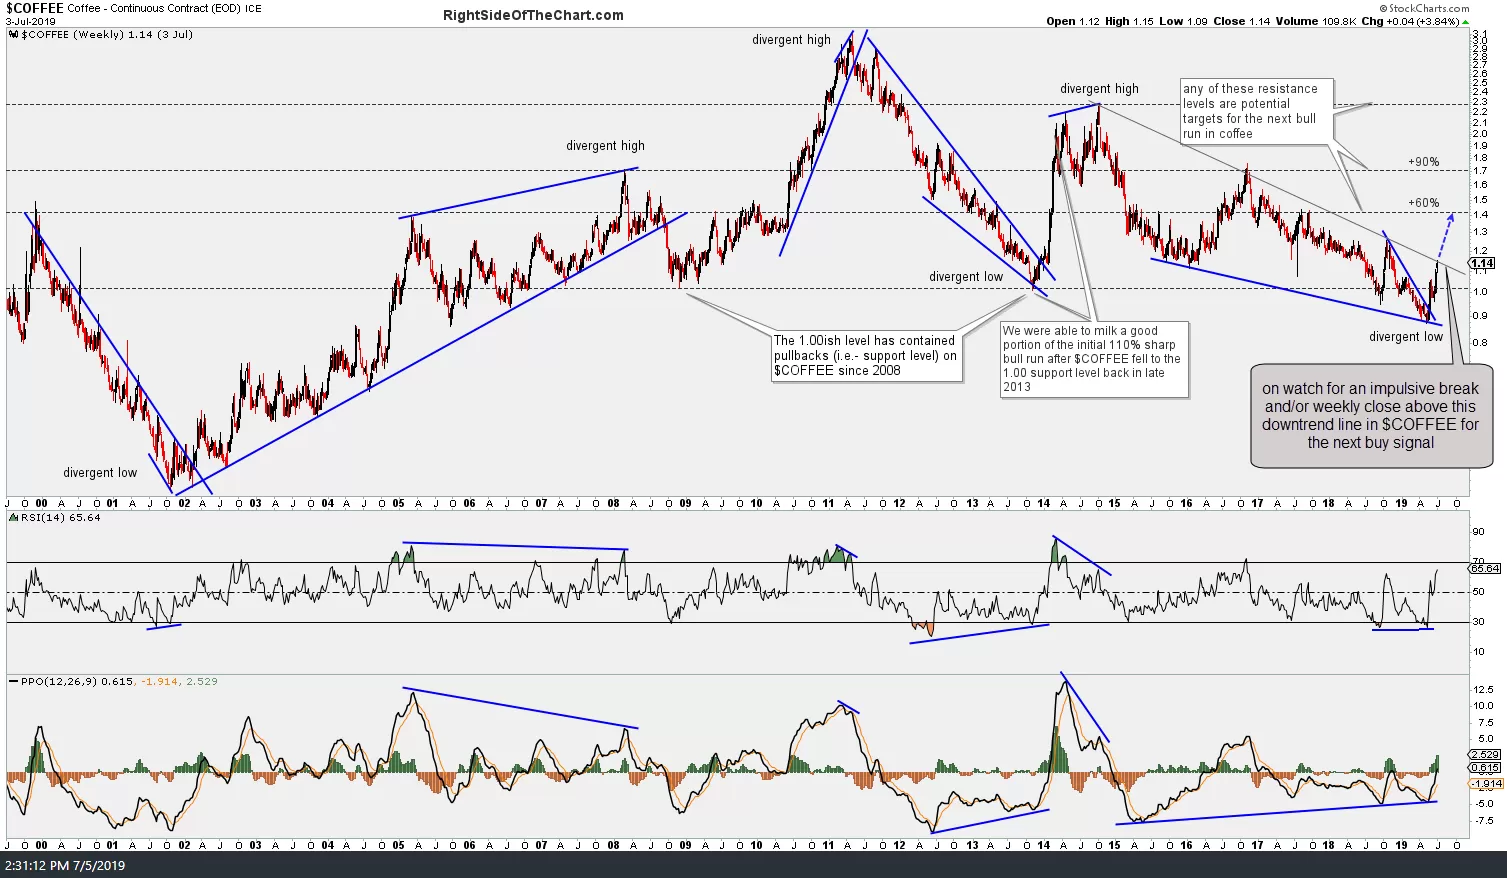
The first chart below is my weekly chart of $COFFEE (the symbol for coffee futures on stockcharts.com, same as /KC on the IB 60-minute charts below). Stockcharts.com provides EOD (end-of-day) updated on futures so although I just took this screenshot today, it reflects coffee futures prices as of yesterday’s close.
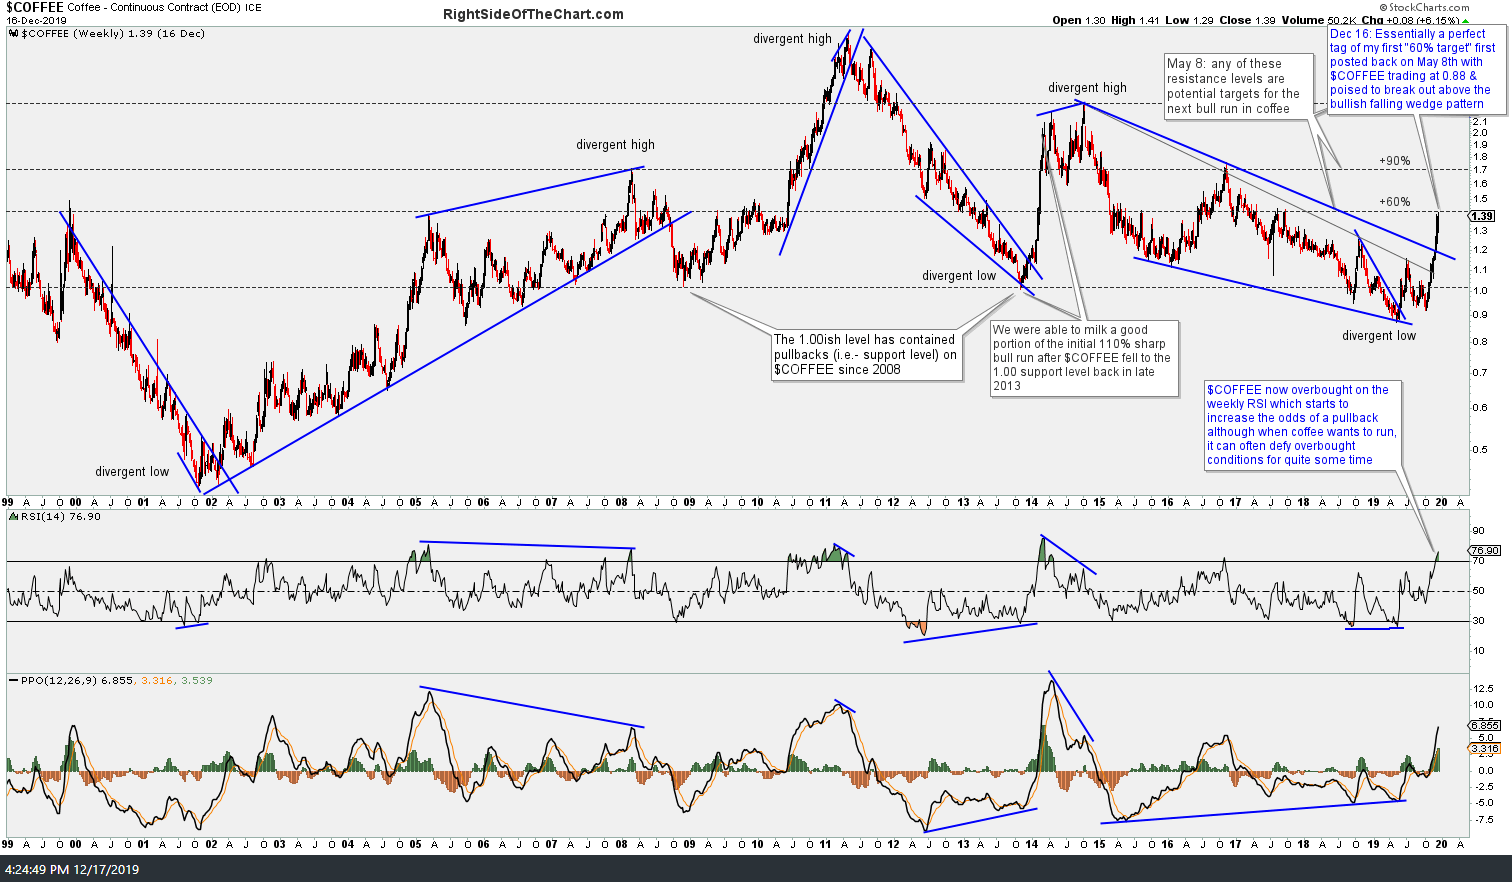
$COFFEE 20-yr weekly Dec 16th close
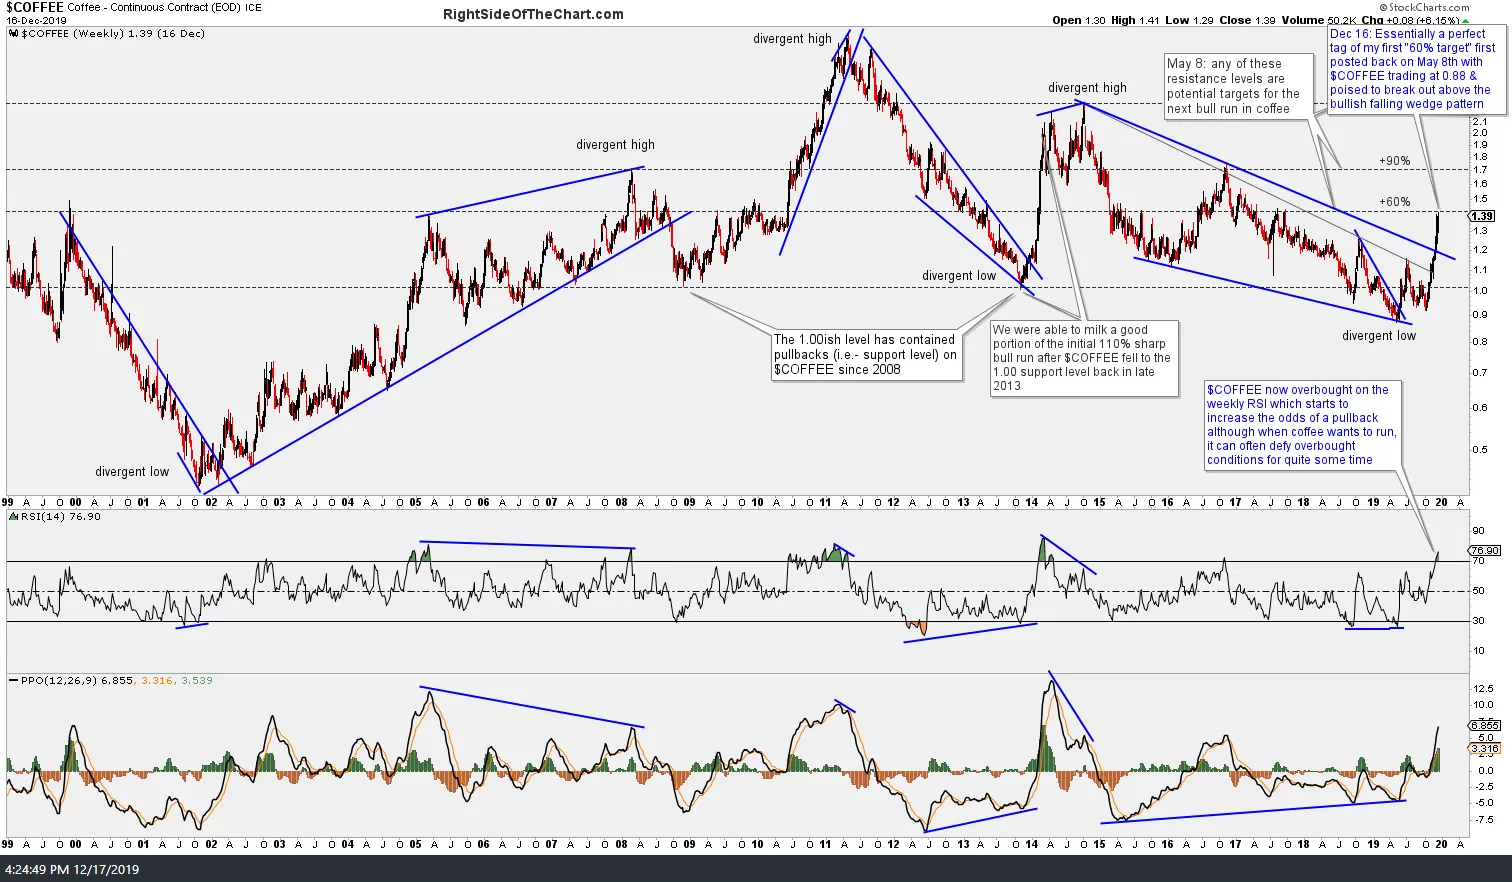
$COFFEE/KC hit a high of 1.4245 yesterday which was exactly (rounded to the nearest cent at 1.42 as stockcharts.com only quotes/rounds out to the second decimal) my first bull market price target from over 7 months ago back on May 8th (first chart below followed by the subsequent weekly charts), the exact day that coffee bottomed in a vicious bear market that had wiped out over 70% its value since the previous bull market top back in 2011.
click first chart to expand, then click arrow at right to advance
-

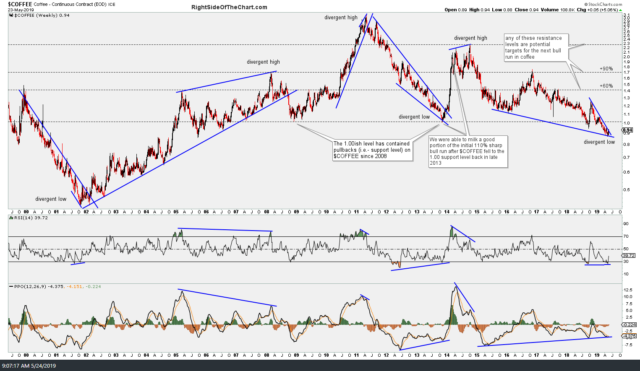
- $COFFEE 20-yr weekly May 8th

-
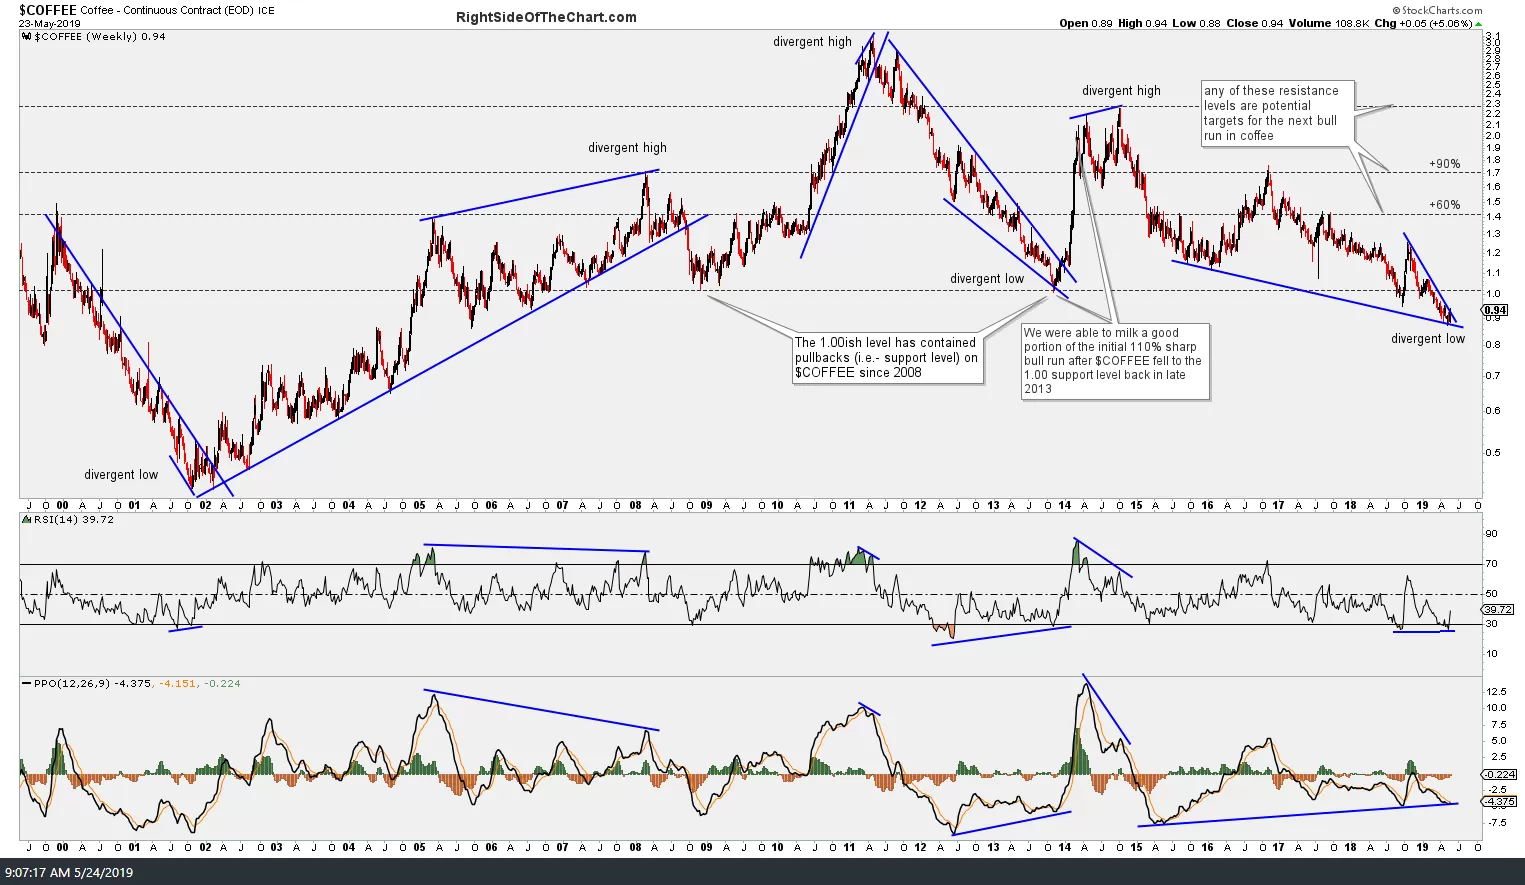
- $COFFEE 20 yr weekly May 24th
-

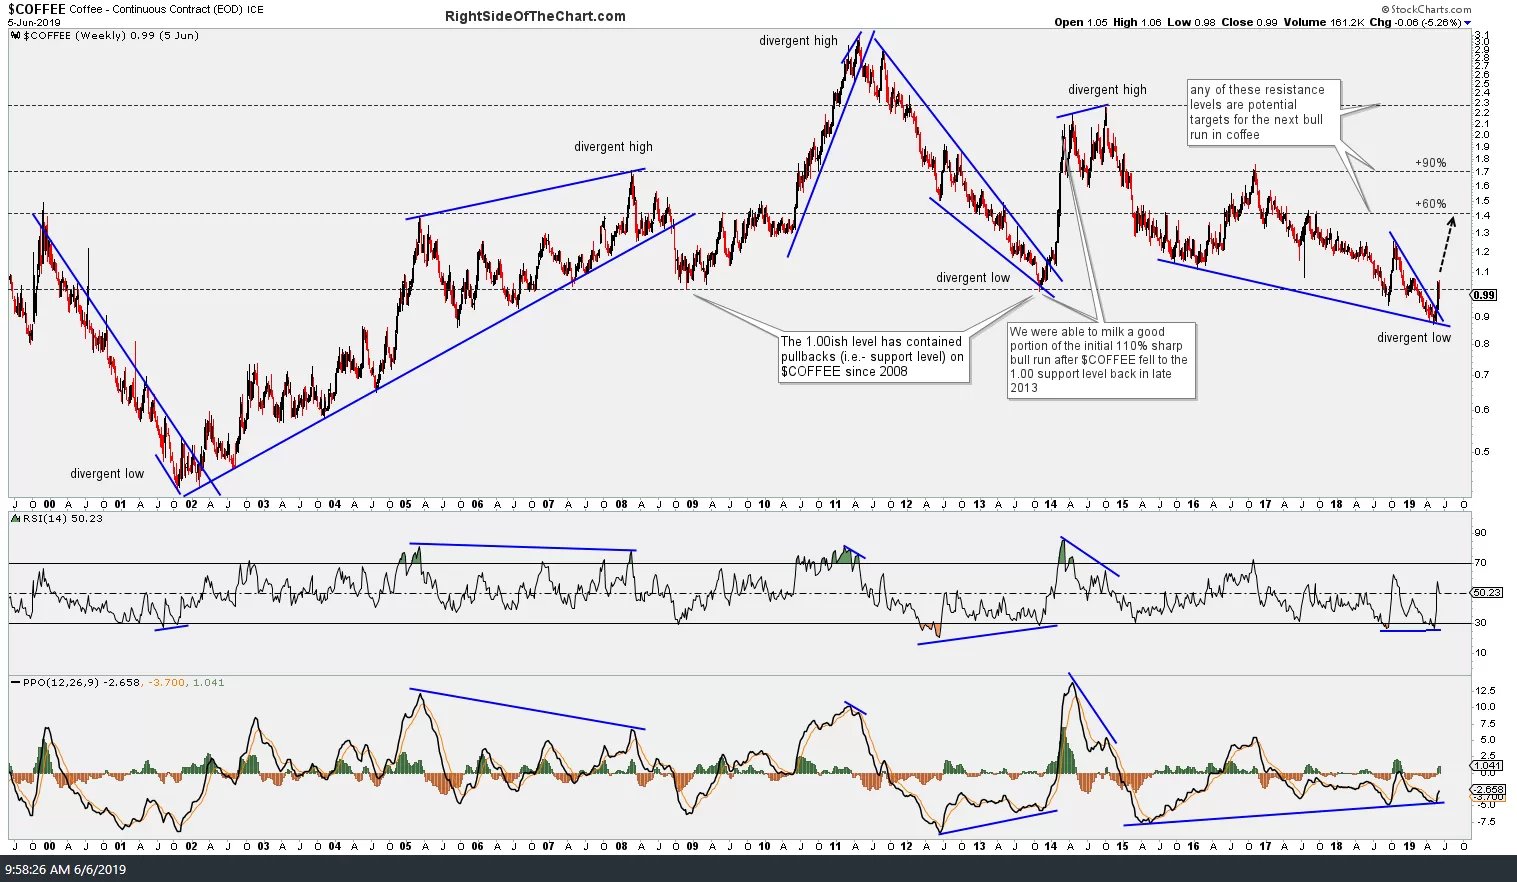
- $COFFEE 20-yr weekly June 6th
-

- $COFFEE 20-yr weekly July 5th
-
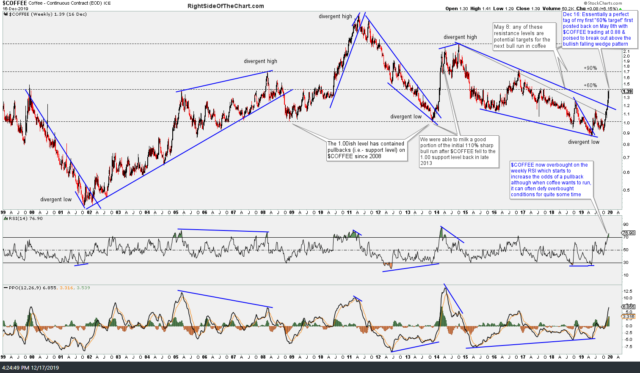
- $COFFEE 20-yr weekly Dec 16th close
Shortly after that chart was posted, coffee went on to break out above the bullish falling wedge pattern (the lower-most downtrend line) which was the catalyst for the 60% rally since then into yesterday’s high when that initial bull market target was hit. As with most charts that list multiple price targets, the odds for a reaction off the initial tag of each target are decent, especially if the charts are indicating a pullback is likely at the time the trade gets there.
Zooming down to the 60-minute time frame, /KC (coffee futures) closed at the middle uptrend line within the Ascending Broadening Wedge Pattern today following another sharp pullback off the most recent divergent high. While support is support until & unless broken, a break below this upper trendline would likely bring /KC down to the lower trendline/1.24 support level (my minimum price target) with a solid break below that level quite possibly triggering more downside to the 1.14ish support.
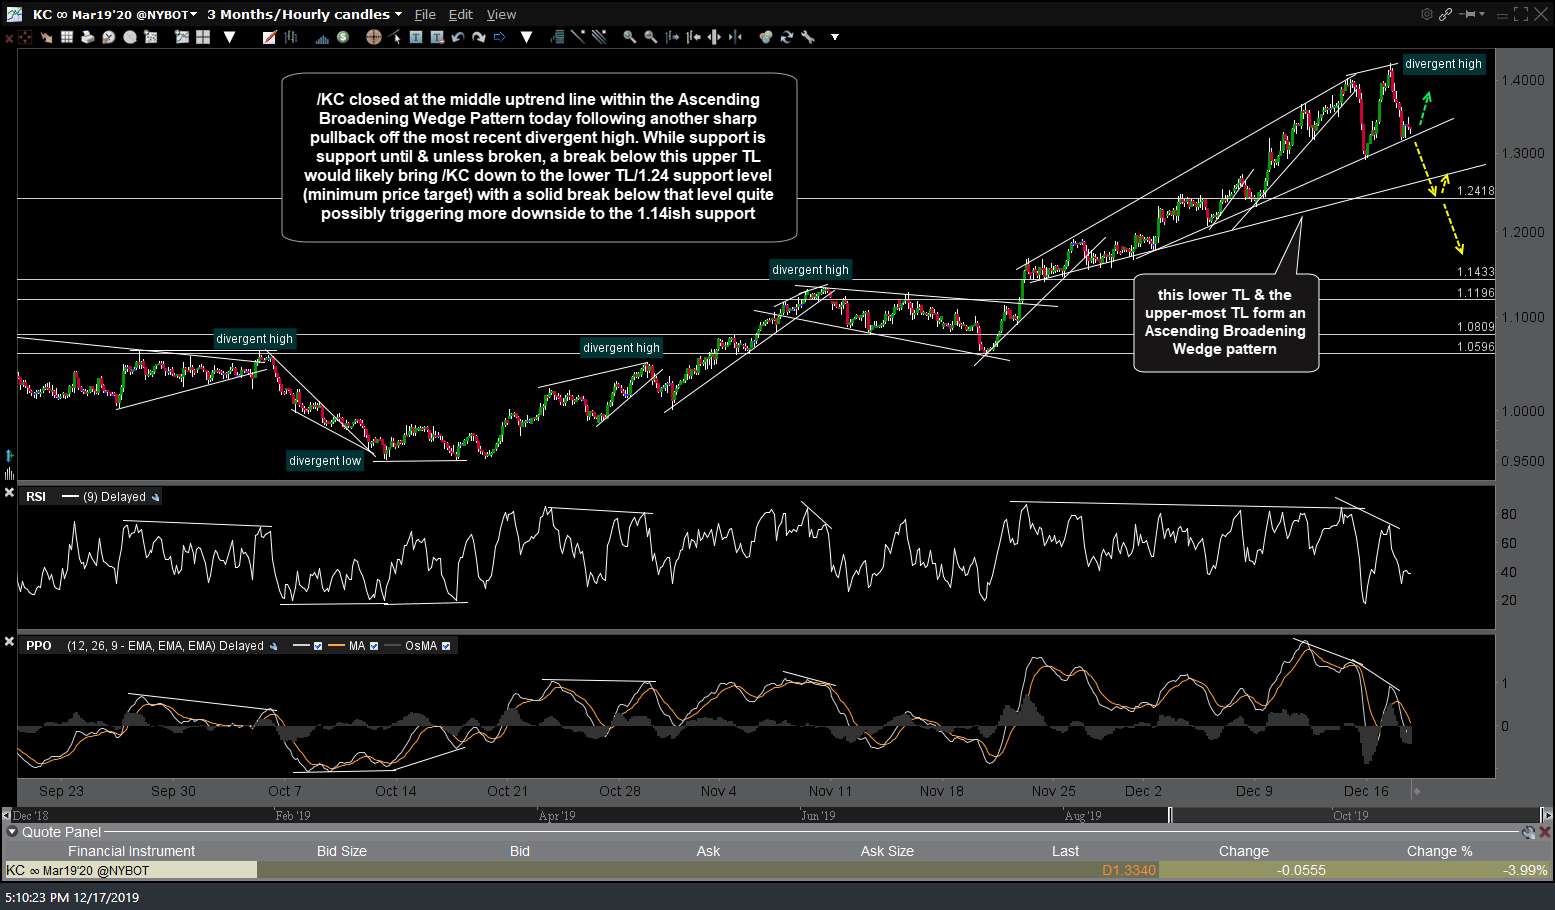
KC 60m Dec 17th
For those that prefer trading ETFs/ETNs, should JO drop much below today’s low of 42.68, that would likely trigger the sell signal pending on /KC coffee futures, opening the door for a drop down towards the 39.40 level on JO.
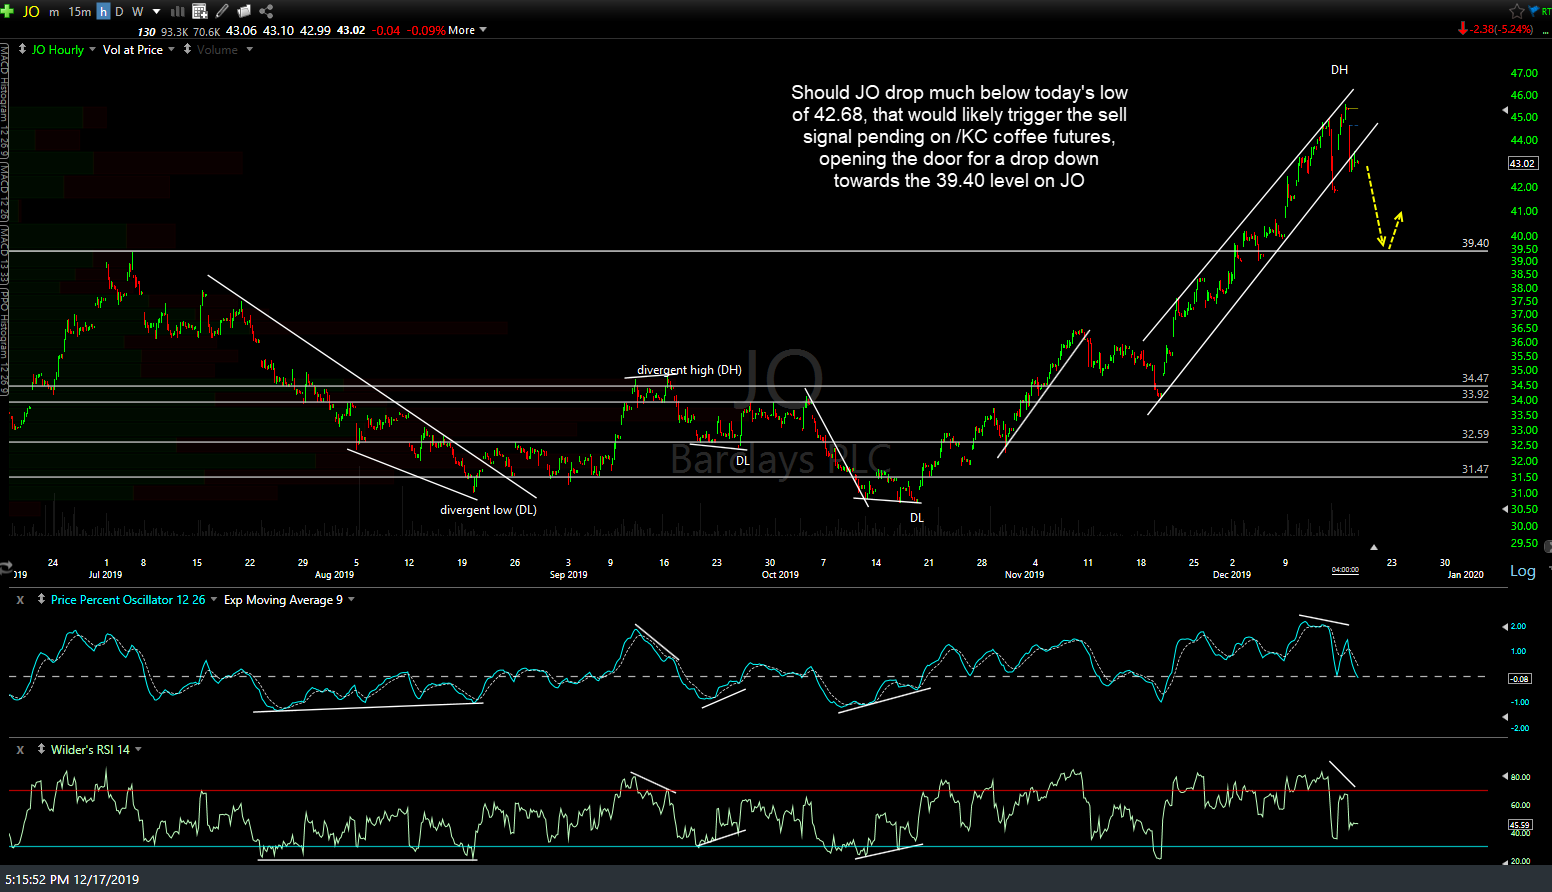
JO 60m Dec 17th
As I’ve repeatedly stated in the past, when coffee wants to run, it can really run. As such, I have to caution anyone taking this unofficial short trade idea, assuming that an objective entry is triggered on a solid break and/or 60-minute close below the middle trendline, to make sure not to let the trade get away from you if coffee triggers a whipsaw (false) sell signal below the trend line and/or a second sell signal on a break below the Ascending Broadening Wedge (lower-most trendline) & then reverses & resumes the uptrend.
The longer-term (weekly) charts still look very constructive, especially considering the impulsive nature of the most recent/current rally in coffee & I still maintain my next long-term price target of at or just below the 1.71 level which would represent a 90% gain from the May 8th low, if hit. Coffee has a way of shrugging off overbought readings as if they aren’t there for quite some time during bull runs at times although as you can see on the weekly charts above, there have also been some very sharp corrections that followed tags of the 70 overbought level on the weekly RSI as well (which just hit around 77).