
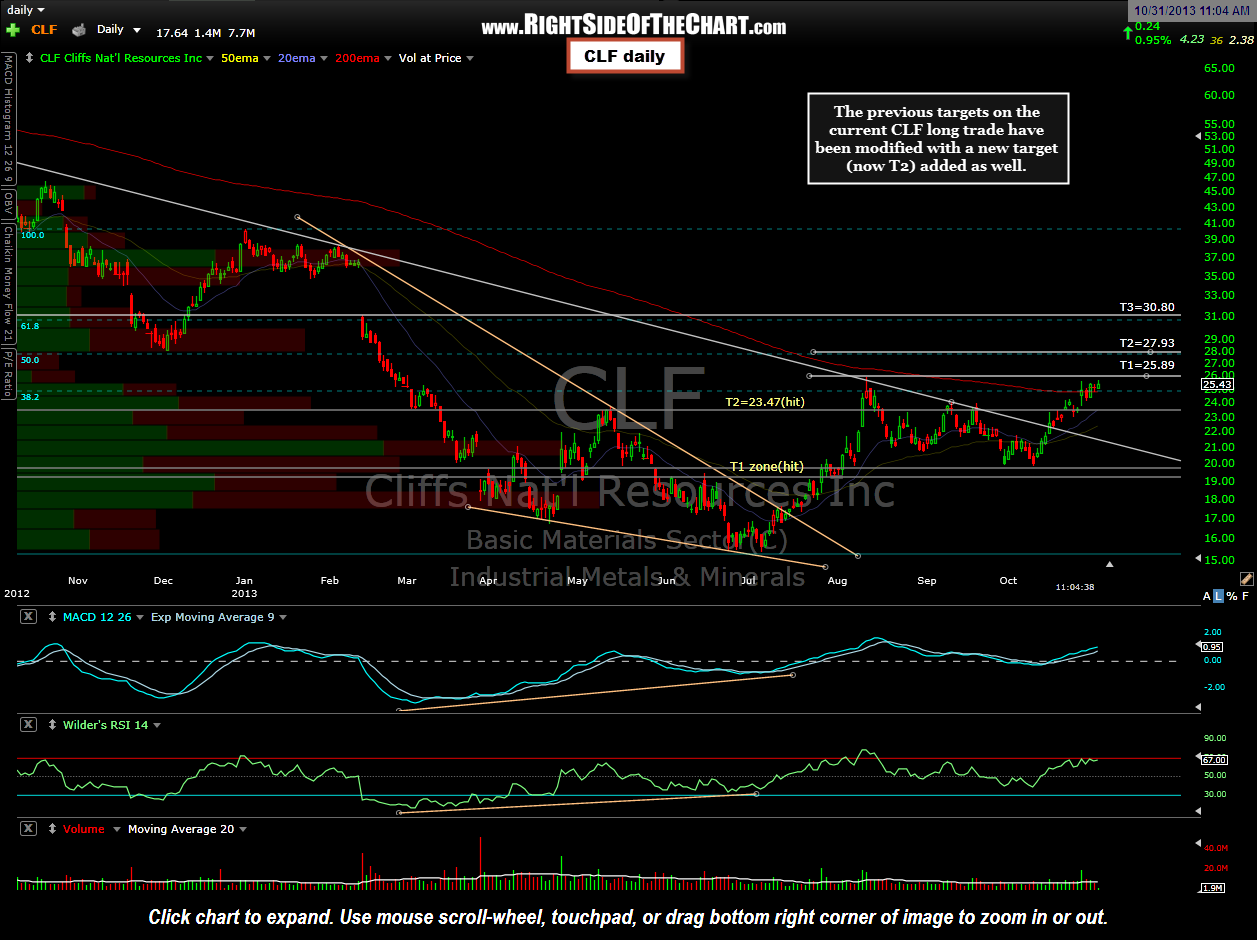
 Just a heads up for those in the CLF long trade: The previous chart posted on Tuesday had incorrectly listed T1 (first target) as 23.92 where I had meant to type 25.92. That target/resistance line is the horizontal line connecting the Aug 12th reaction high of 25.95. Sell targets will usually be placed just shy of the actual level where a reaction is likely to occur & in the case of CLF, a buffer of just 3 cents might be cutting it a bit close on this one so I’ve adjusted it down slightly to make the first target at 25.89.
Upon further reviewing the chart today, I have also decided to add a new profit target at the 27.93 level. This new target lines up with both the 50% Fibonacci retracement of the move down from the Jan 2, 2013 reaction high into the late June/early July lows as well as Dec 4, 2012 reaction low and would provide an 18.9% gain if hit. With the addition of this new second target, the previous T2 now becomes T3 and I have slightly modified that target level as well. T3 is now 30.80, which lines up well with both the 61.8% retracement of the same leg lower in the stock as well as somewhat below the bottom of the large Feb 13, 2013 gap, which should act as formidable resistance when challenged from below. Updated daily chart shown here.