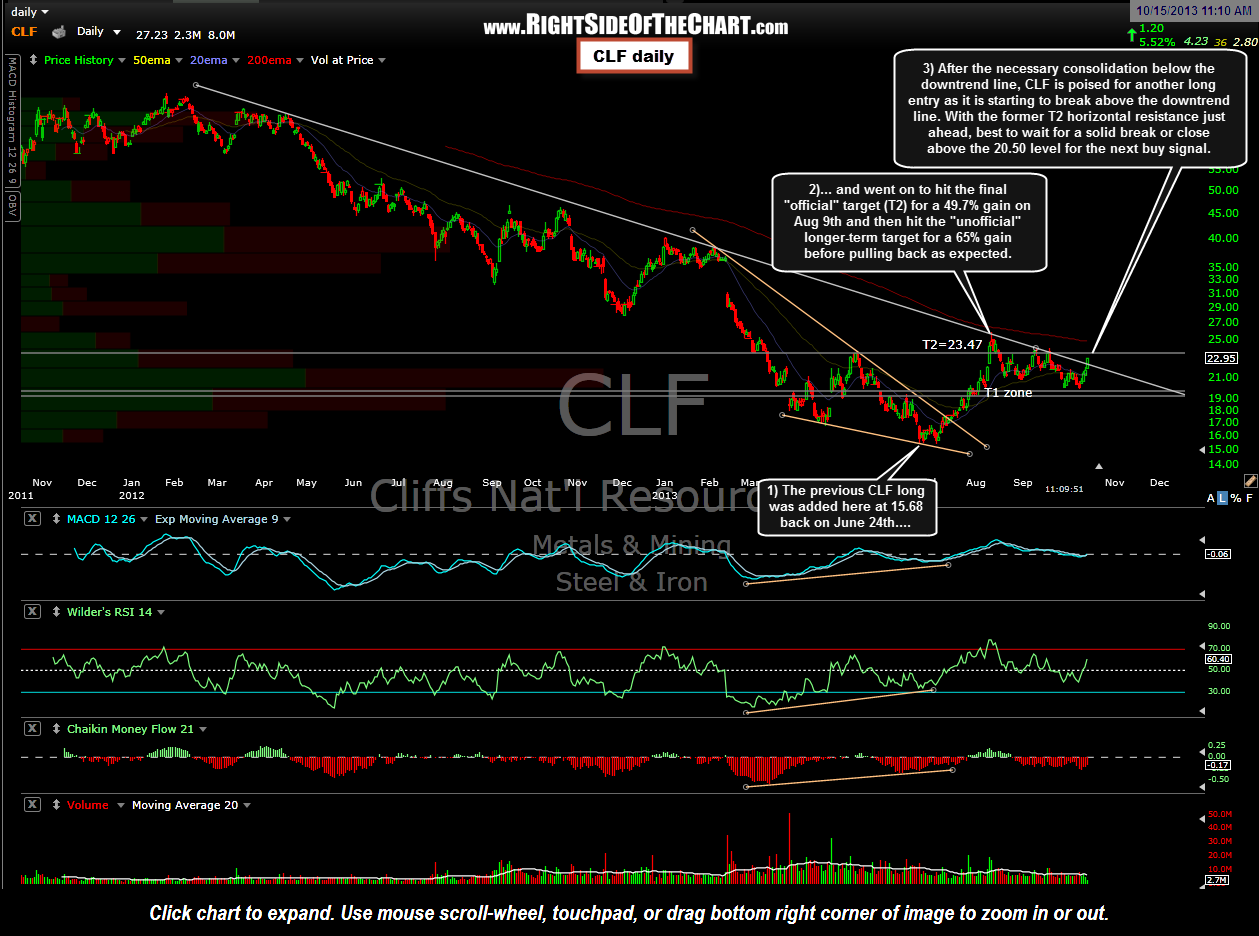
 CLF will be added as a Long Trade Setup with an entry to be triggered on a break or close above the 23.50 level. The previous CLF trade is a text-book example of technical analysis at its finest. The previous CLF long was added as an active trade at 15.68 back on June 24th while the stock was at the bottom of a falling wedge pattern (and at multi-year lows while solidly entrenched in a downtrend). The stock then went on to break above the falling wedge pattern and hit the final “official” target (T2) for a 49.7% gain on Aug 9th while continuing even higher to hit the “unofficial” longer-term target for a 65% gain before pulling back as expected from that formidable resistance level.
After the necessary consolidation below the downtrend line, CLF is poised for another long entry as it is starting to break above the downtrend line. With the former T2 horizontal resistance just overhead, best to wait for a solid break or close above the 23.50 level for the next buy signal. This trade will likely be added to the Long-Term Trades category as well and if so, the 31.20- 36 area would most likely be the target range. For the regular Long Trade (which encompasses typically swing trades with expected holding periods from a couple of weeks to a few months), targets and suggested stops will follow if the stock prints a solid close above the 23.50 level. The chart above is the updated daily chart for this trade followed by the string of the daily charts from the previous trade below for reference. As always, make sure that this or any trade aligns with your own trading style, objectives, and market bias (long or short).
-

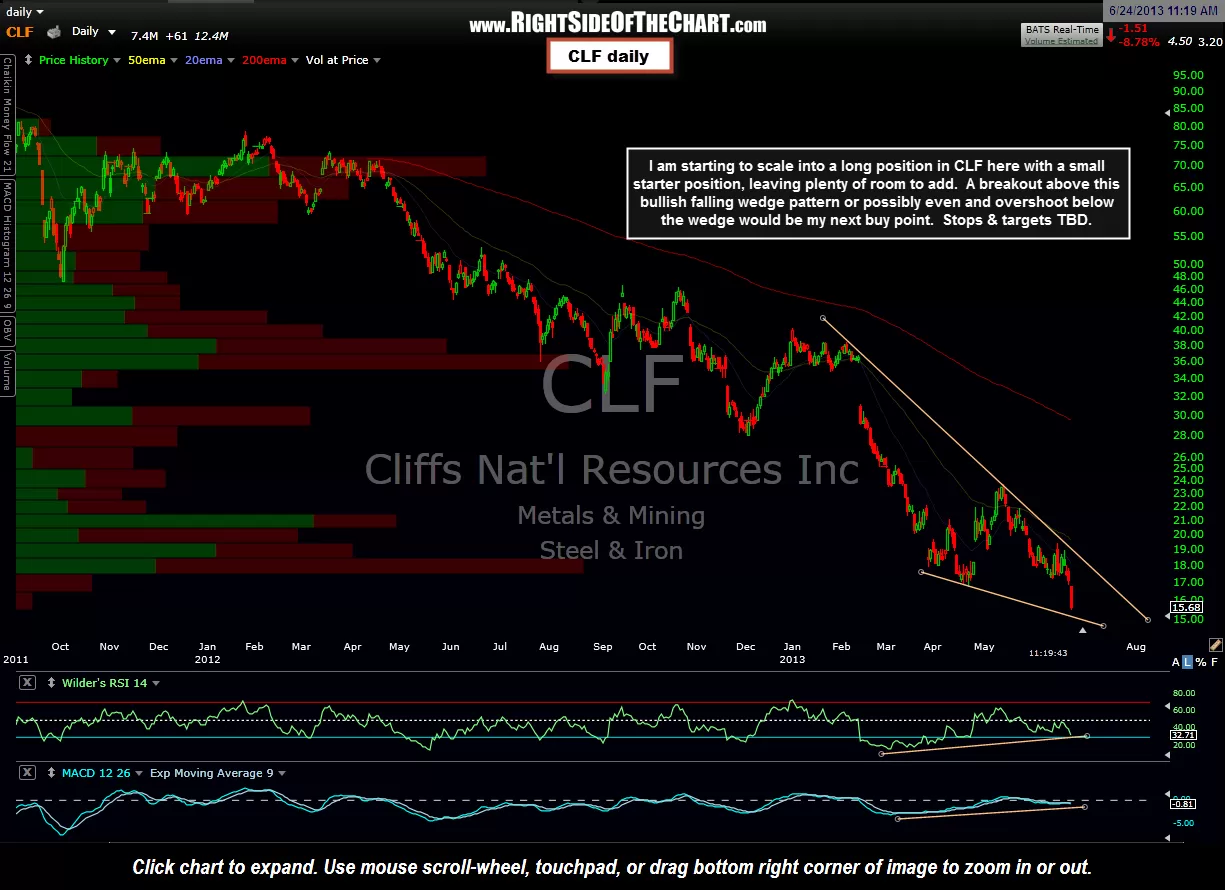
- Entry on previous CLF Long Trade
-

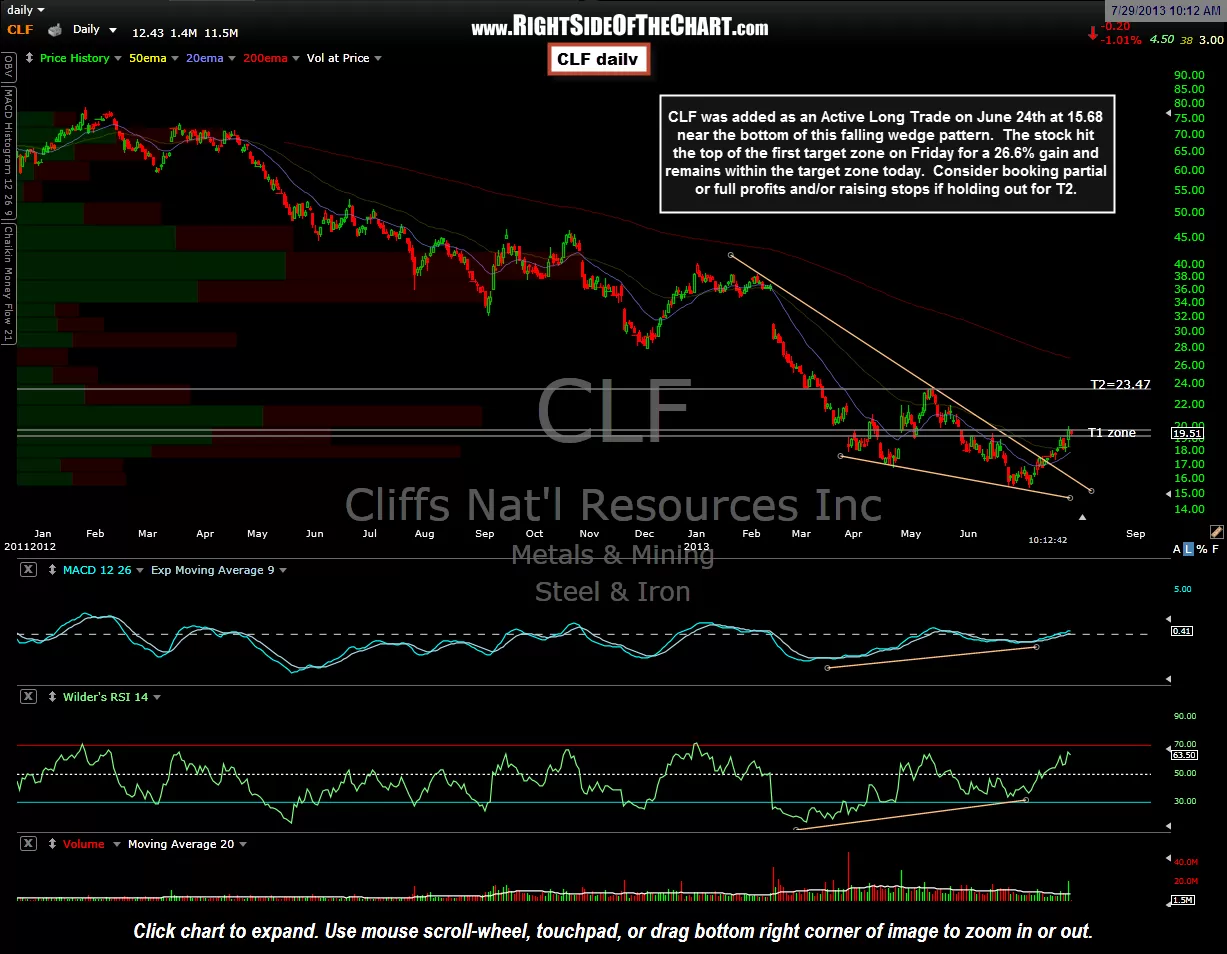
- First Target Hit on Previous CLF Trade
-

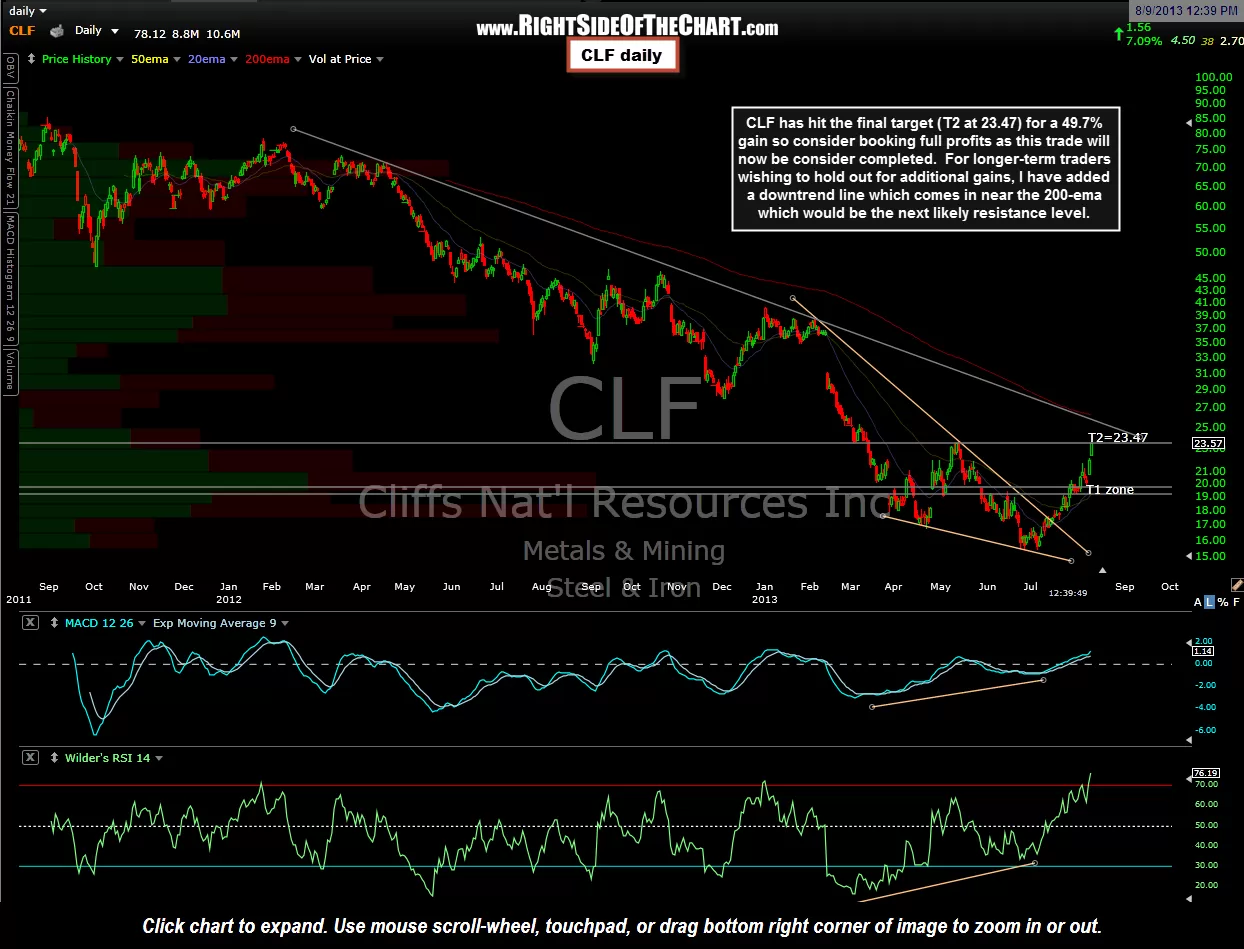
- Second Target Hit on Previous CLF Trade