
The following video provides technical analysis of swing trade ideas on 8 stocks within the chemical sector including objective entry levels & price targets. Silver or Gold level access initially required.
The following stocks are covered in this order: SQM, MEOH, EMN, FF, RYAM, VHI, HUN & APD (plus the static charts of LXU below)
playback speed can be increased in the settings to reduce video duration
LXU was one of 9 stocks in the chemicals sector that stood out when I went through all of the components but it appears that I had inadvertently skipped over it in the video so I’ve included the daily & weekly charts, along with some key levels, below. Arrow breaks mark potential targets/resistance levels on this daily chart of LXU with a buy signal to come on a solid break & close above 3.30 & then the downtrend line.

LXU daily July 19th
LXU had a waterfall sell-off once it broke below this weekly triangle pattern & the primary trend is clearly bearish with the near-term trend currently bullish. While the case for a potential rally can be made should it trigger a buy signal on the daily chart, it should also be noted that the stock appears to have recently broken down from a bear flag continuation pattern on this weekly chart. LXU is scheduled to report earnings on July 29th, after the market close (AMC).
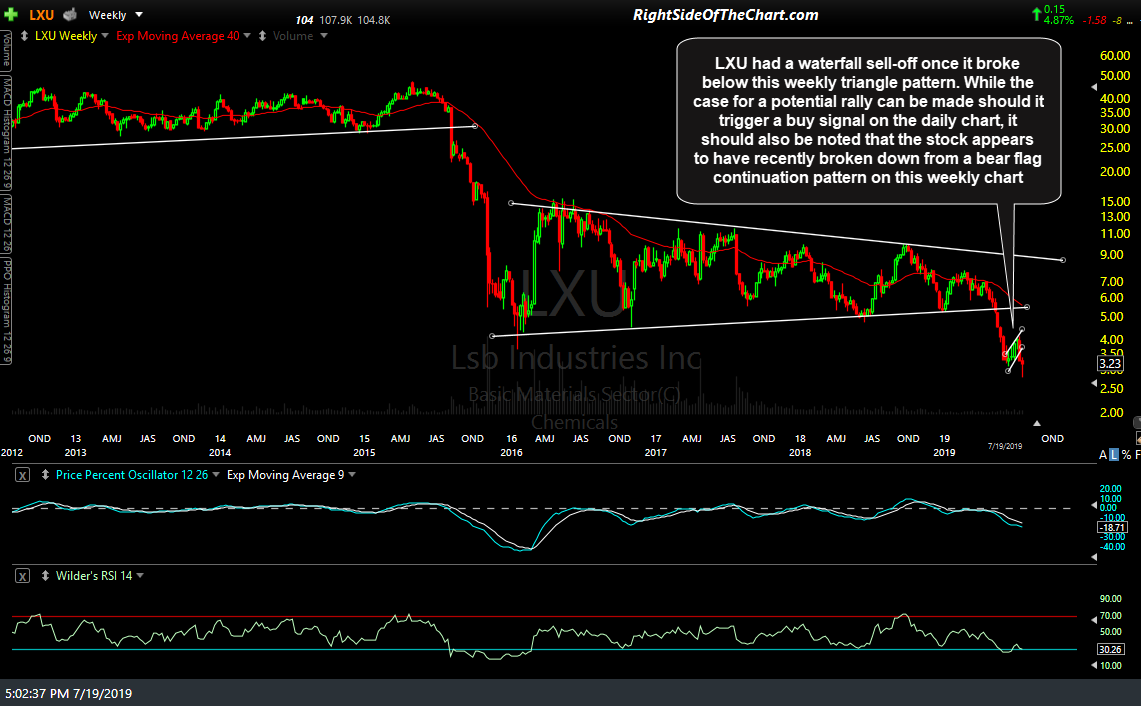
LXU weekly July 19th