The charts of the cannabis sector have been firming up recently with quite a few leading marijuana stocks starting to exhibit some bullish price action recently & some others appear poised to rally on impulsive breakouts above some nearby resistance levels, downtrend lines and/or potentially bullish chart patterns.
I may follow up with video coverage of the sector later but here are some of the standout trade ideas in the sector. Essentially, any nearby price or trendline resistance levels just overhead would trigger objective long entries as would pullbacks to support, for those stocks that have already broken out. Ideally, you want to see 1.5x or better average volume on a breakout as breakouts that occur on average or below-average volume have a higher rate of failure. Arrow breaks on the charts indicate resistance levels/unadjusted price targets where a reaction is likely.
One final consideration: The first chart below is MJ followed by charts of some of the top holdings in that cannabis sector ETF. The primary advantages of trading a sector ETF is both simplicity (one position vs. several) and diversification (you own a basket of stocks so any large & sudden loss on one position due to a negative news event or earnings report should be mitigated by the other positions). On the flip side, I’ve often found that one can outperform a sector (or sector ETF) by going long a handful of individual stocks within the sector that have the most constructive (bullish) charts. Should the outlook for the sector continue to firm up from here, I will likely add some of these as official trade ideas with specific price targets, suggested stops, beta-adjusted position sizes, etc.
Click on the first chart below to expand and then click on the arrow to the right to advance to the next full-size chart. Expanded charts can be panned & zoomed for additional detail. The securities are posted below in this order: MJ, TLRY, ACB, CGC, CRON, TGODF, GWPH, OGI, & HEXO.
-
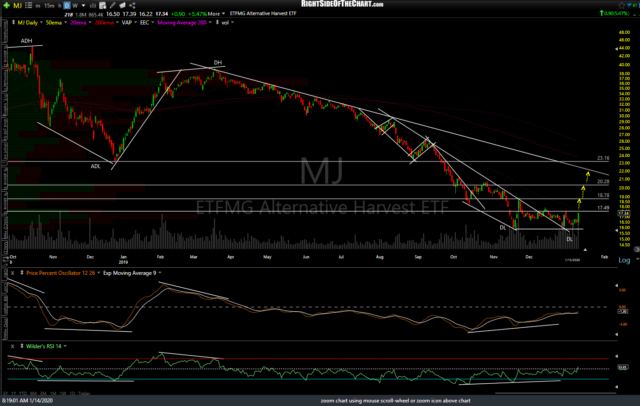
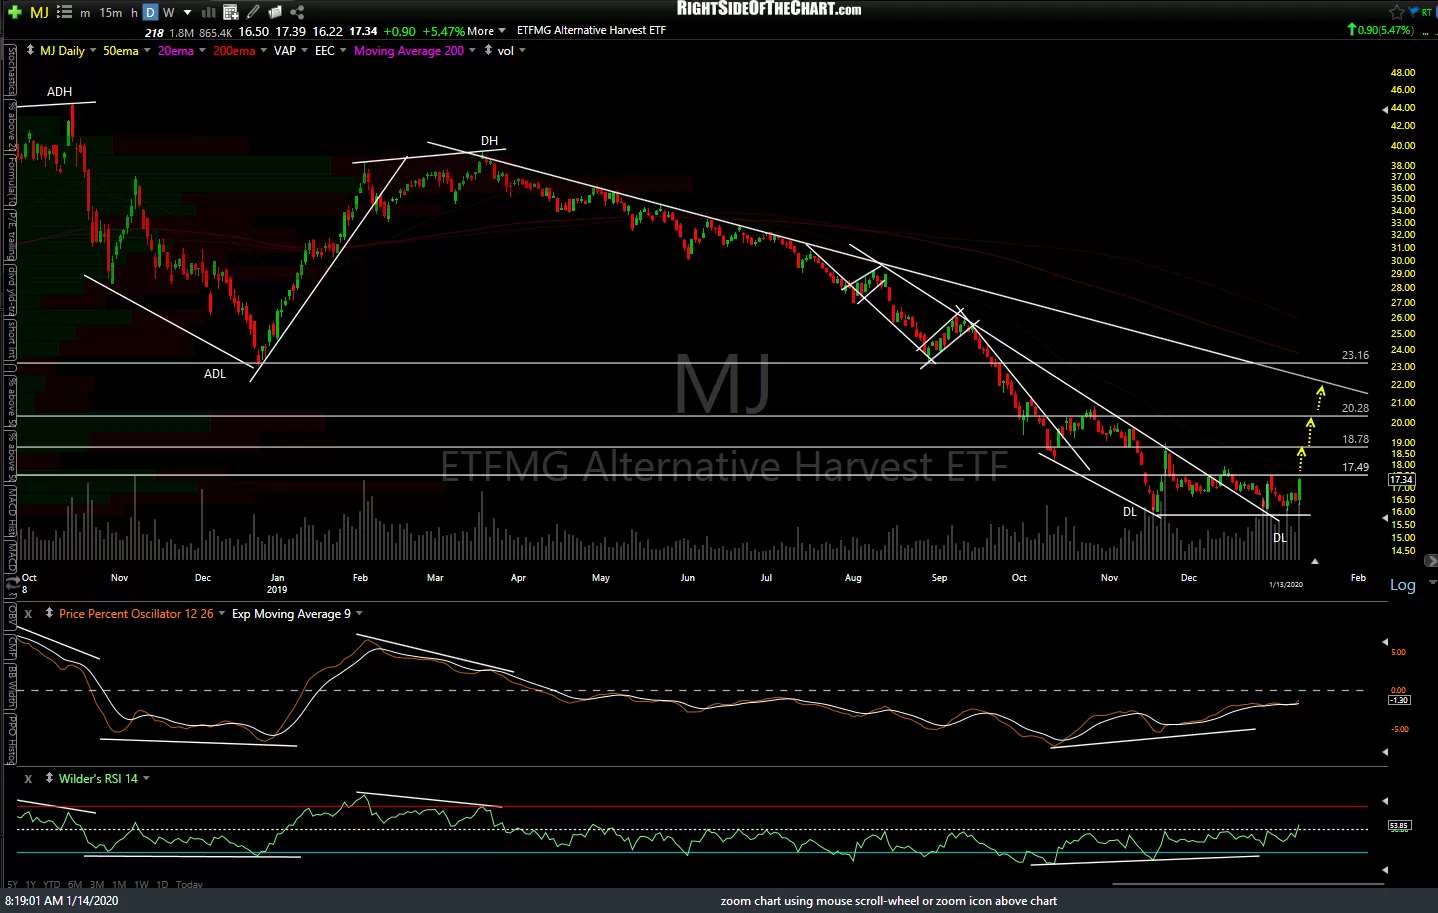
- MJ daily Jan 14th
-
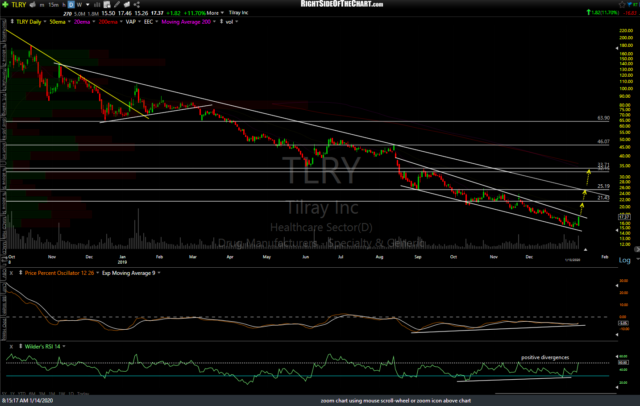
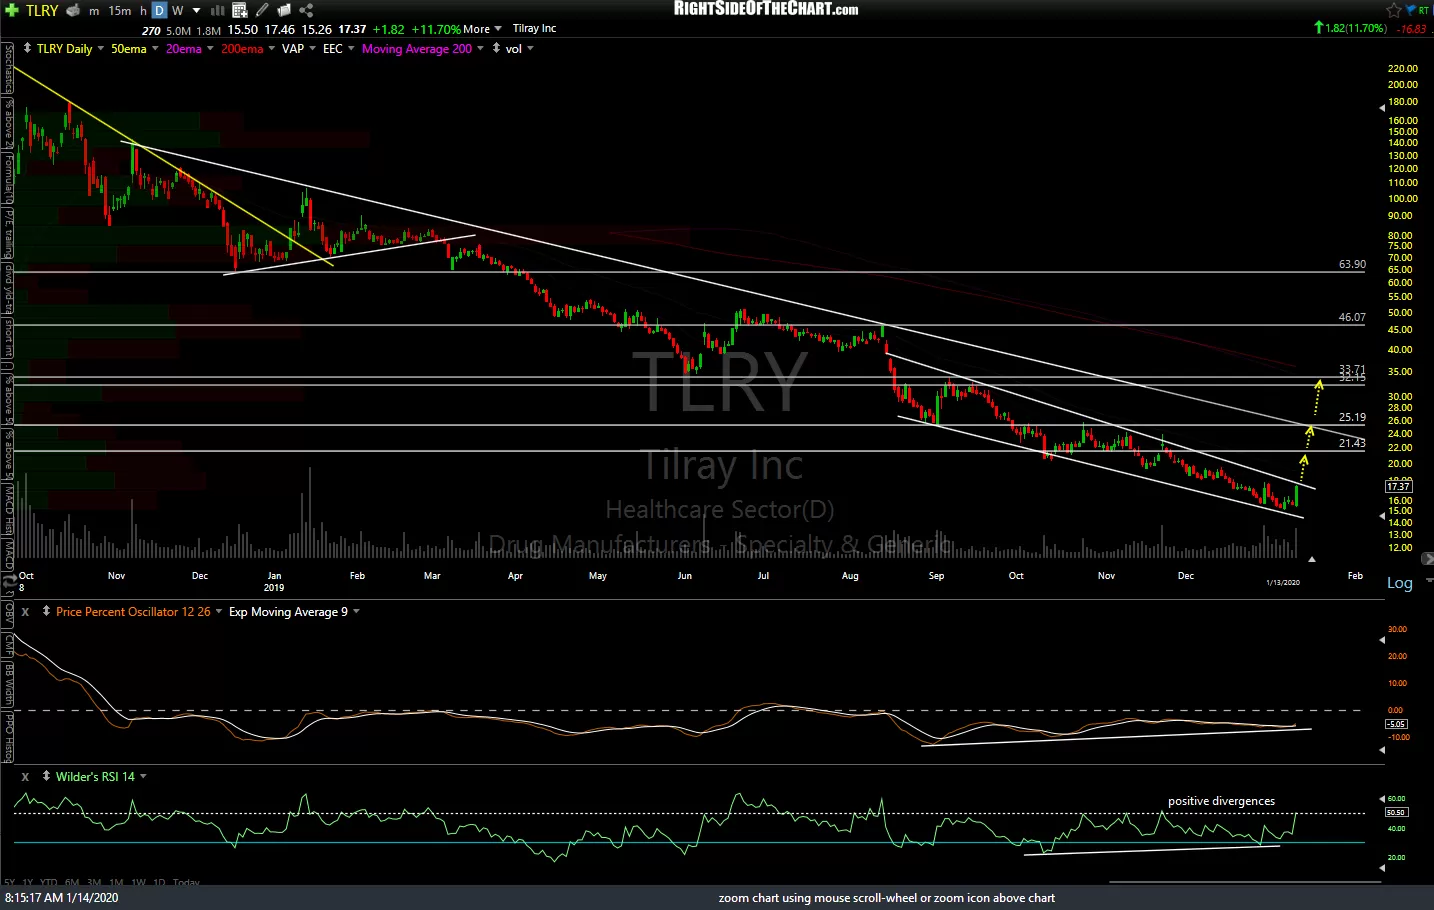
- TLRY daily Jan 14th
-
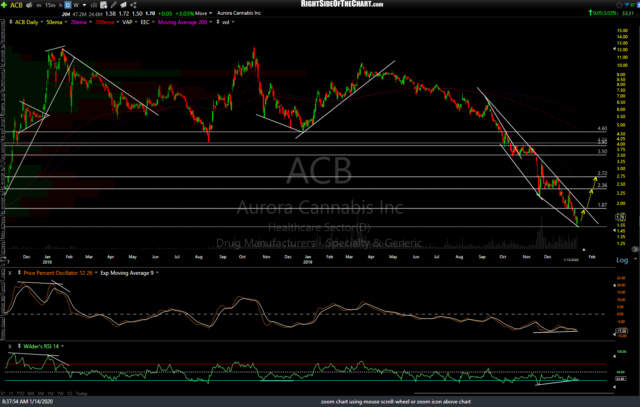
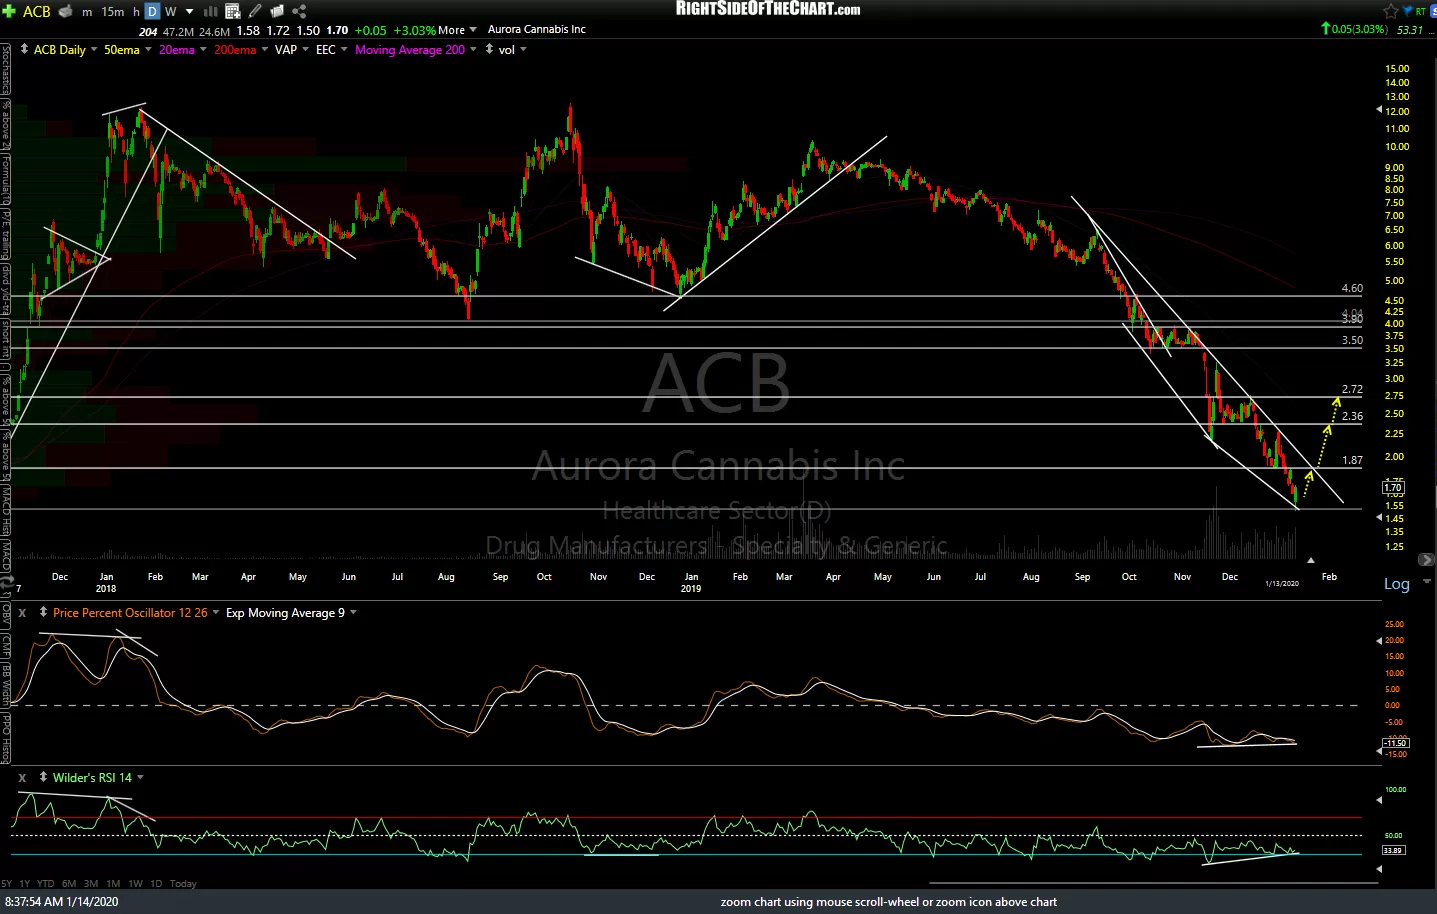
- ACB daily Jan 14th
-
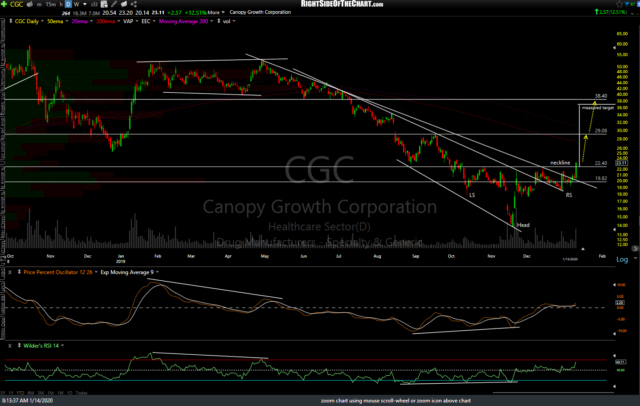
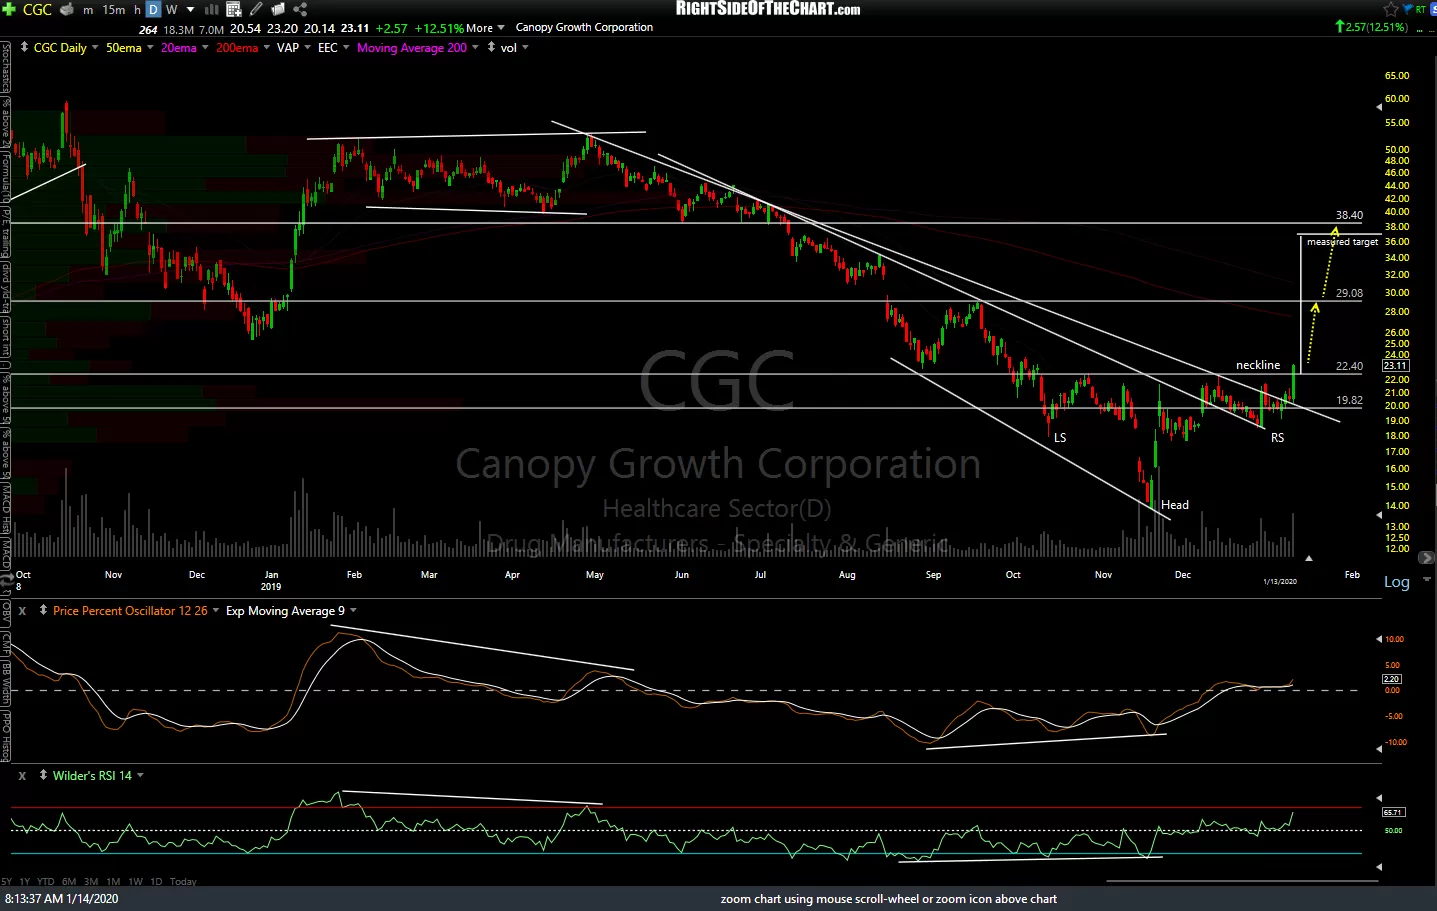
- CGC daily Jan 14th
-
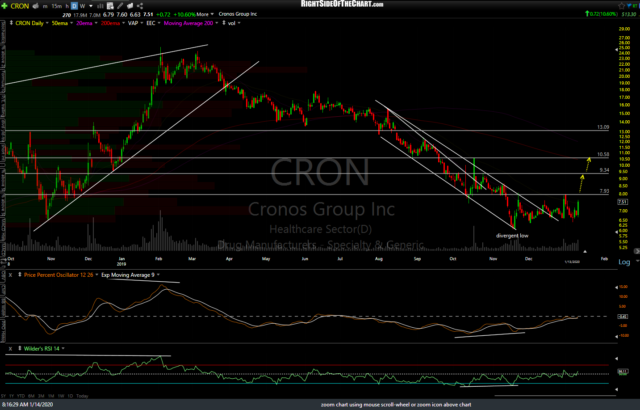
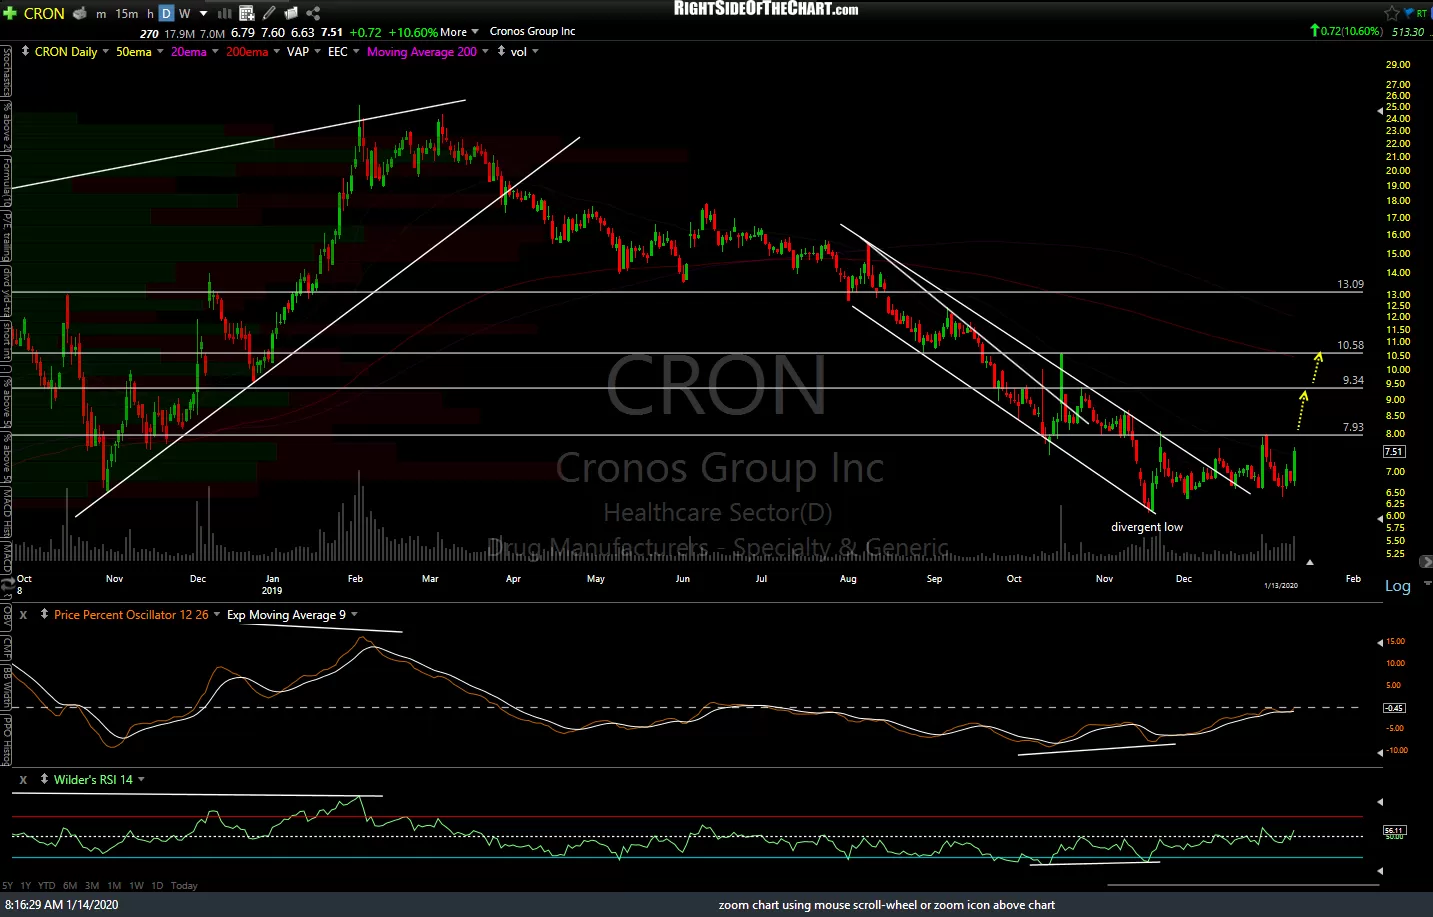
- CRON daily Jan 14th
-
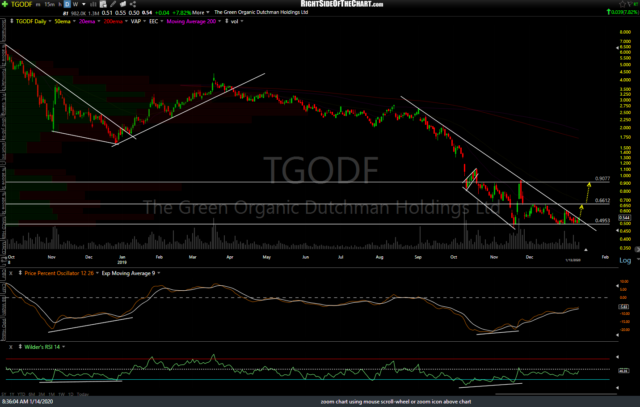
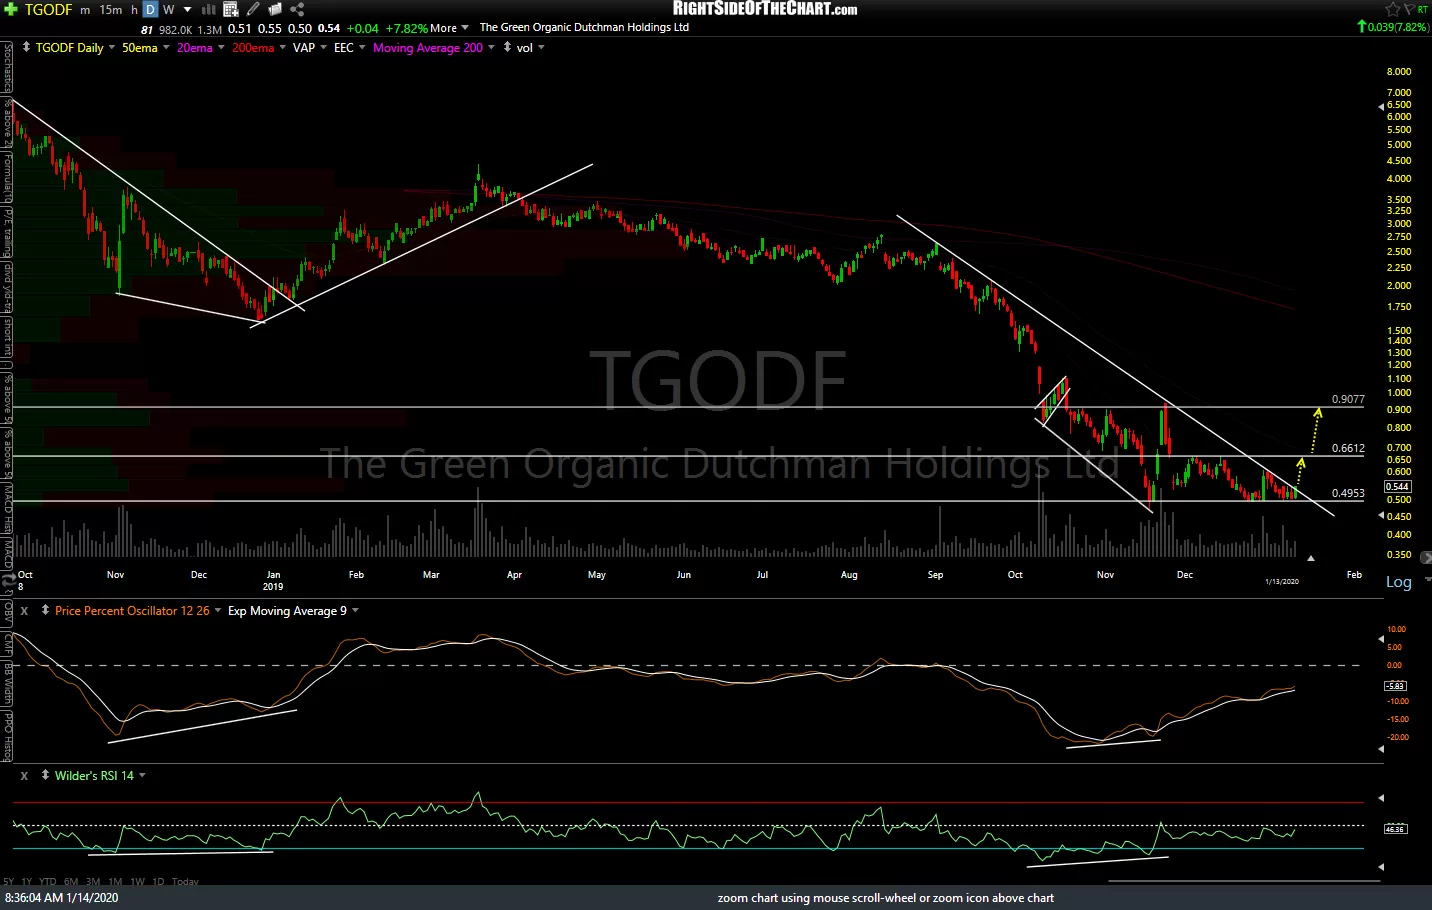
- TGODF daily Jan 14th
-

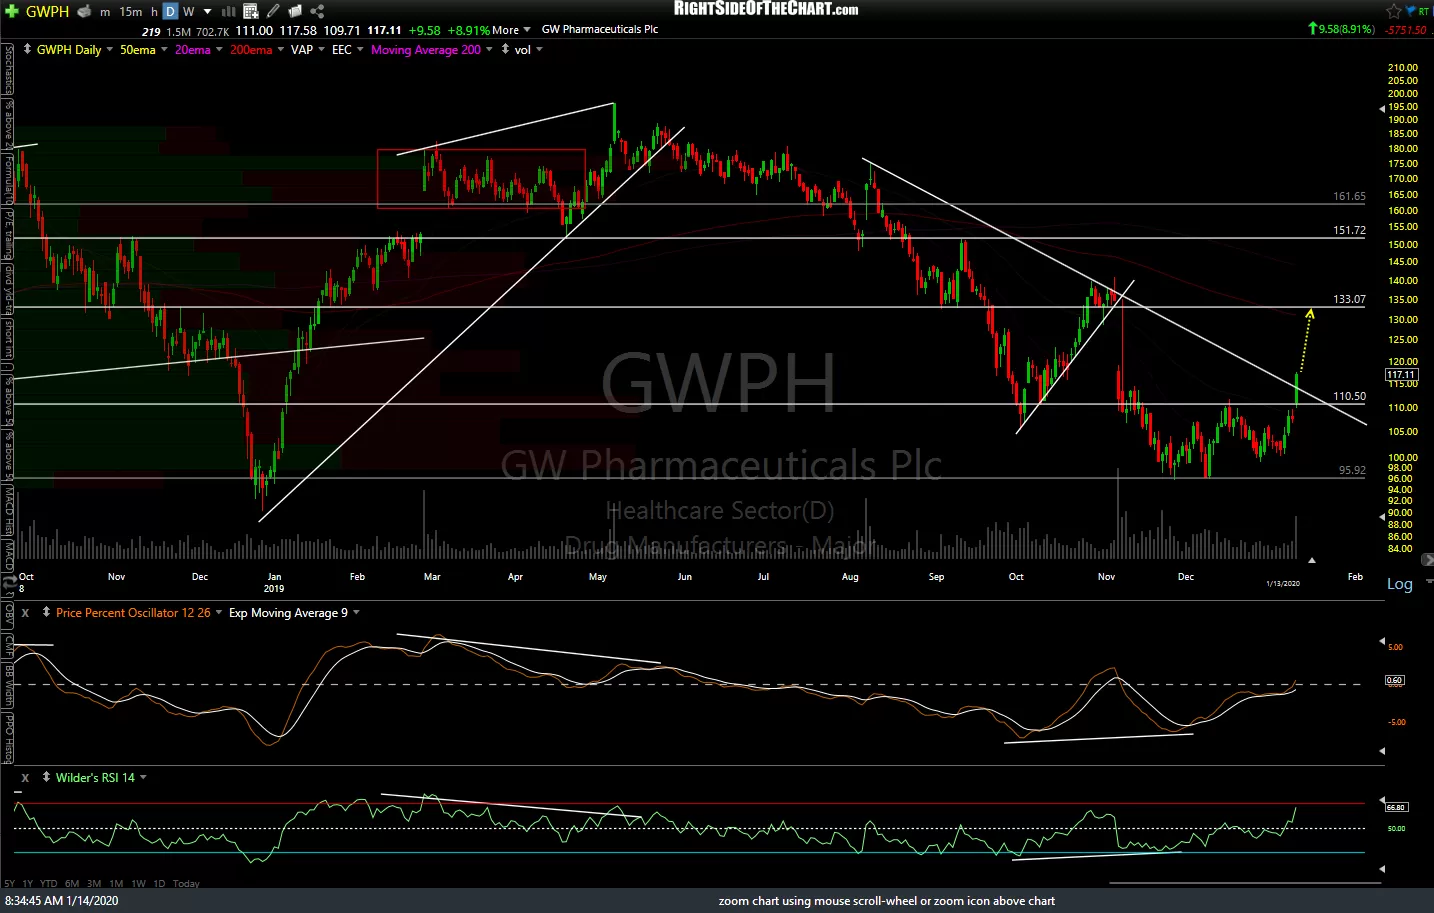
- GWPH daily Jan 14th
-
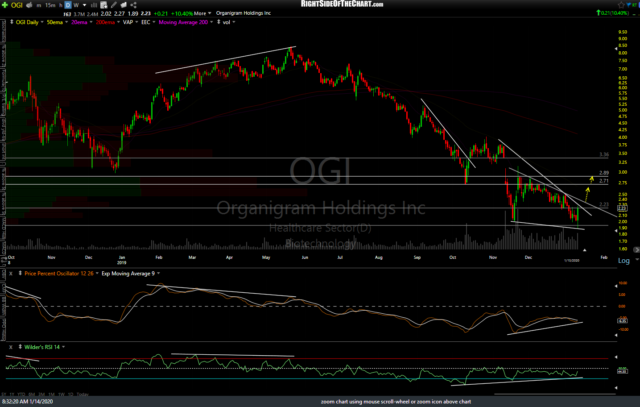
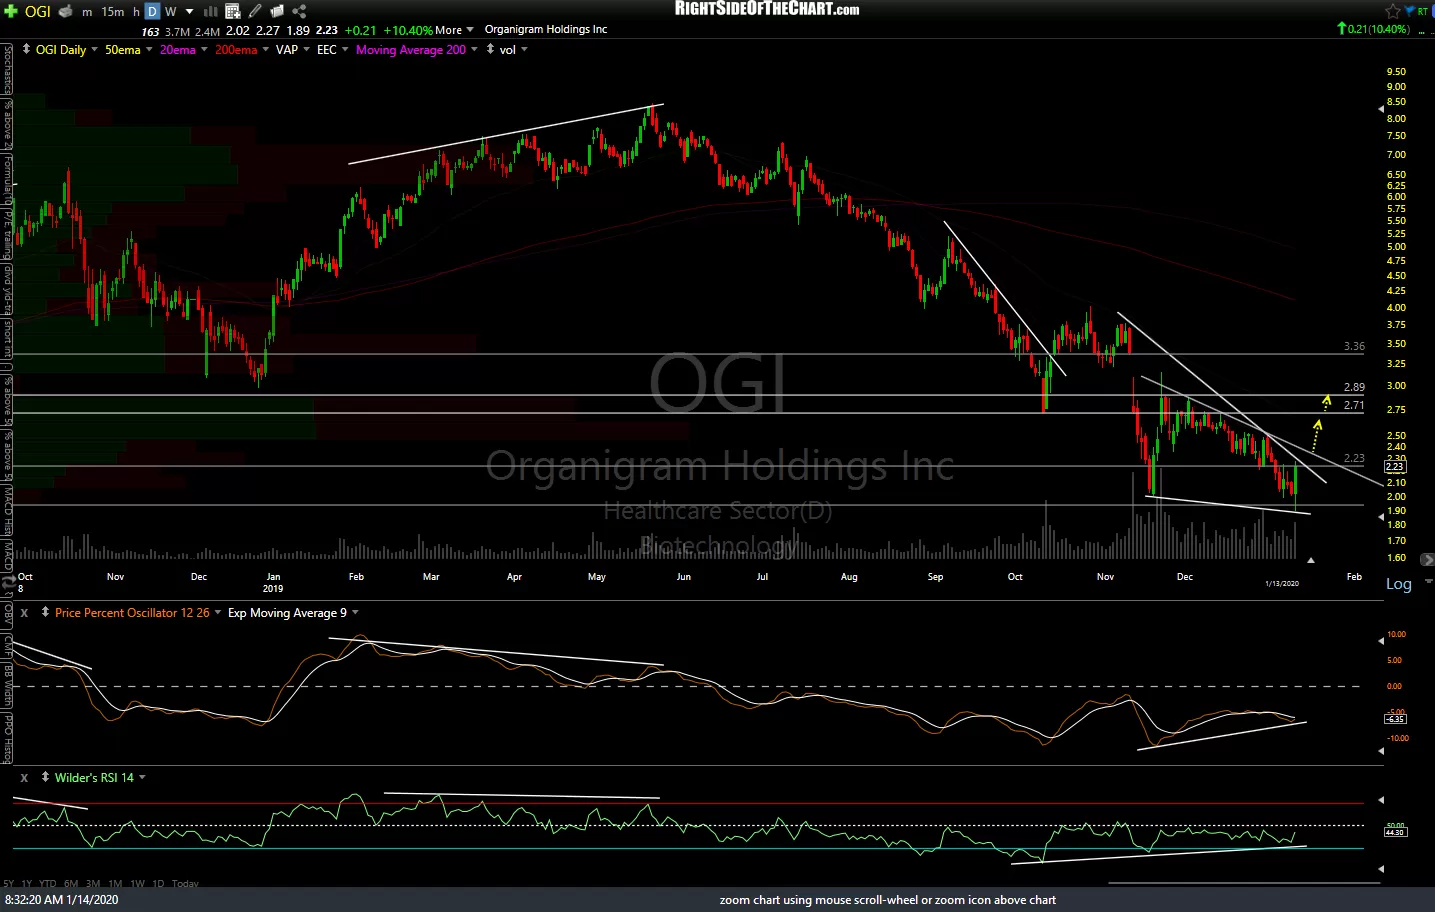
- OGI daily Jan 14th
-
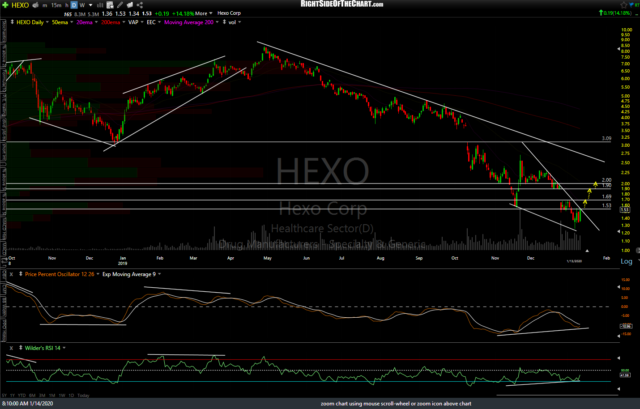
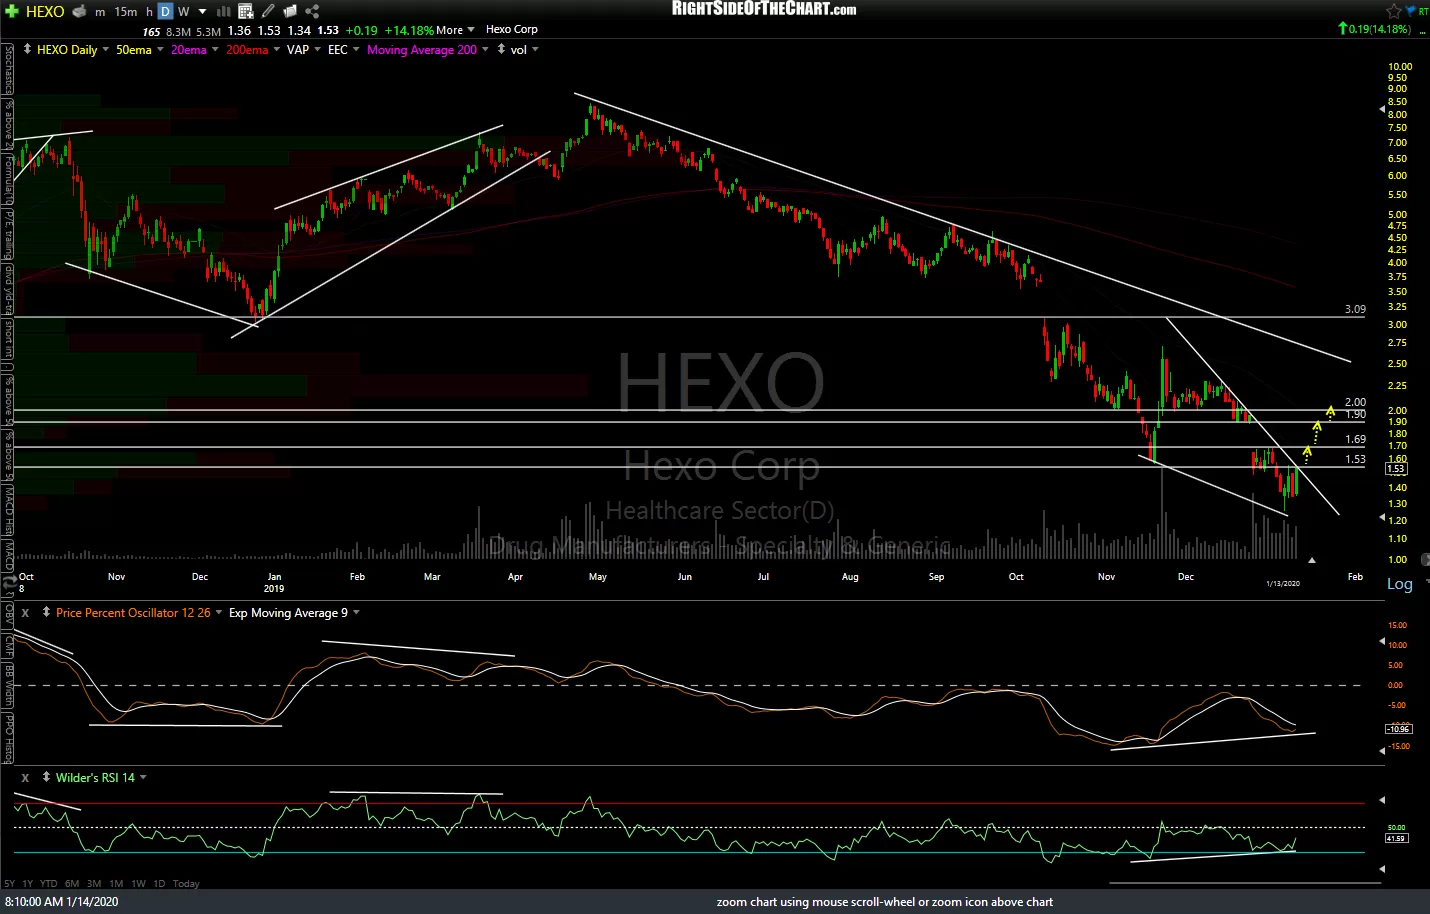
- HEXO daily Jan 14th