
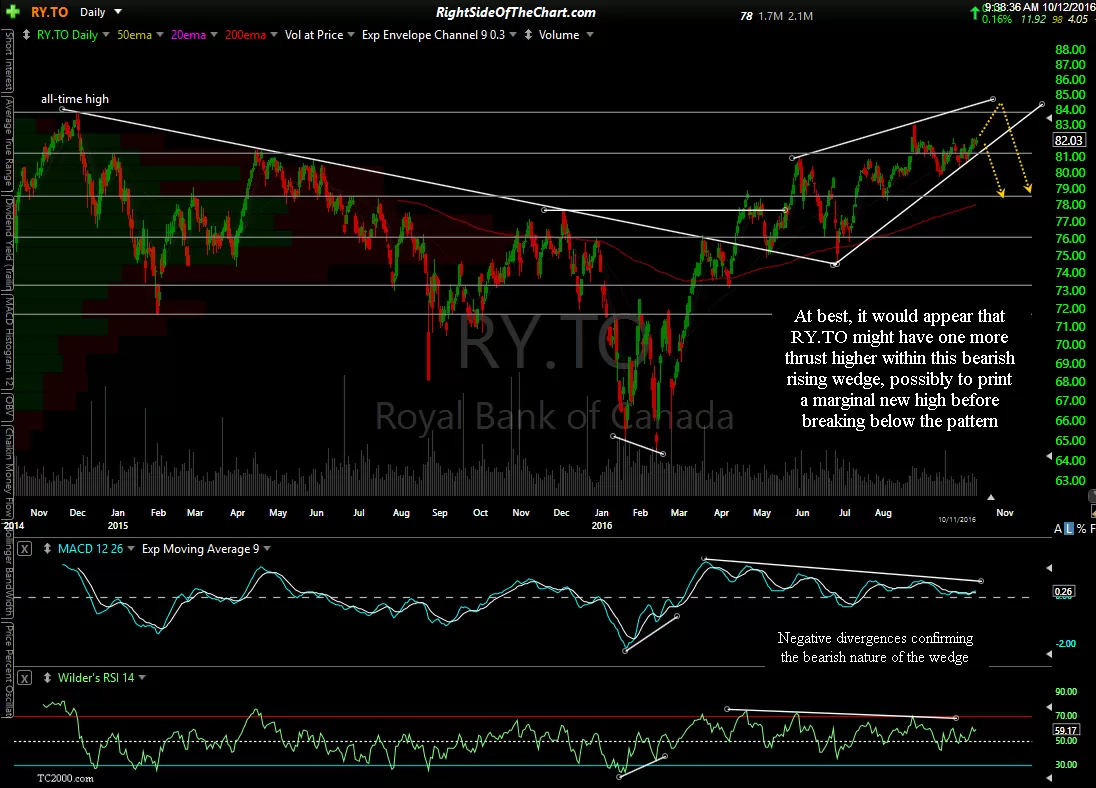
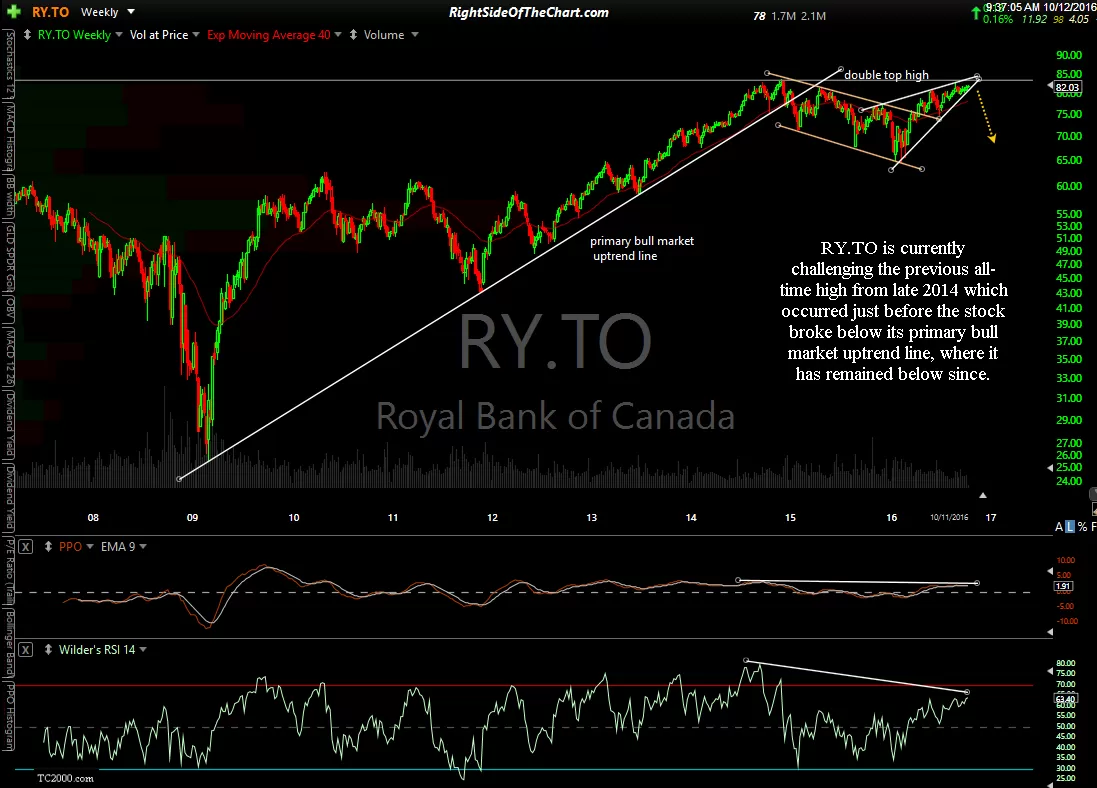
It would appear that the large Canadian banks are poised for a significant correction. Here’s a quick look at the daily & weekly charts of the three largest Canadian banks. At best, it would appear that RY.TO (Royal Bank of Canada) might have one more thrust higher within this bearish rising wedge, possibly to print a marginal new high before breaking below the pattern. RY.TO is currently challenging the previous all-time high from late 2014 which occurred just before the stock broke below its primary bull market uptrend line, where it has remained below since.
-

- RY.TO daily Oct 12th
-
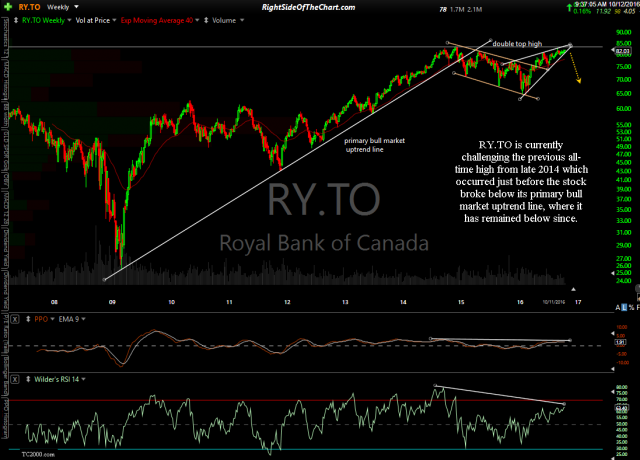
- RY.TO weekly Oct 12th
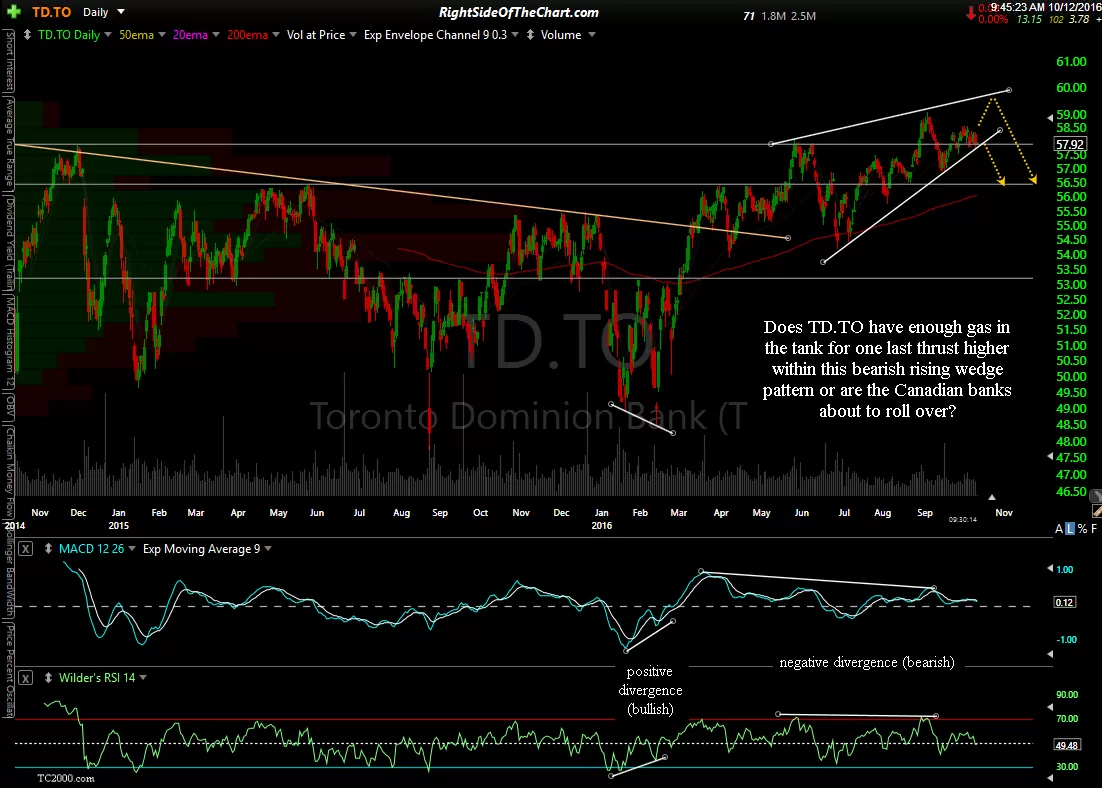
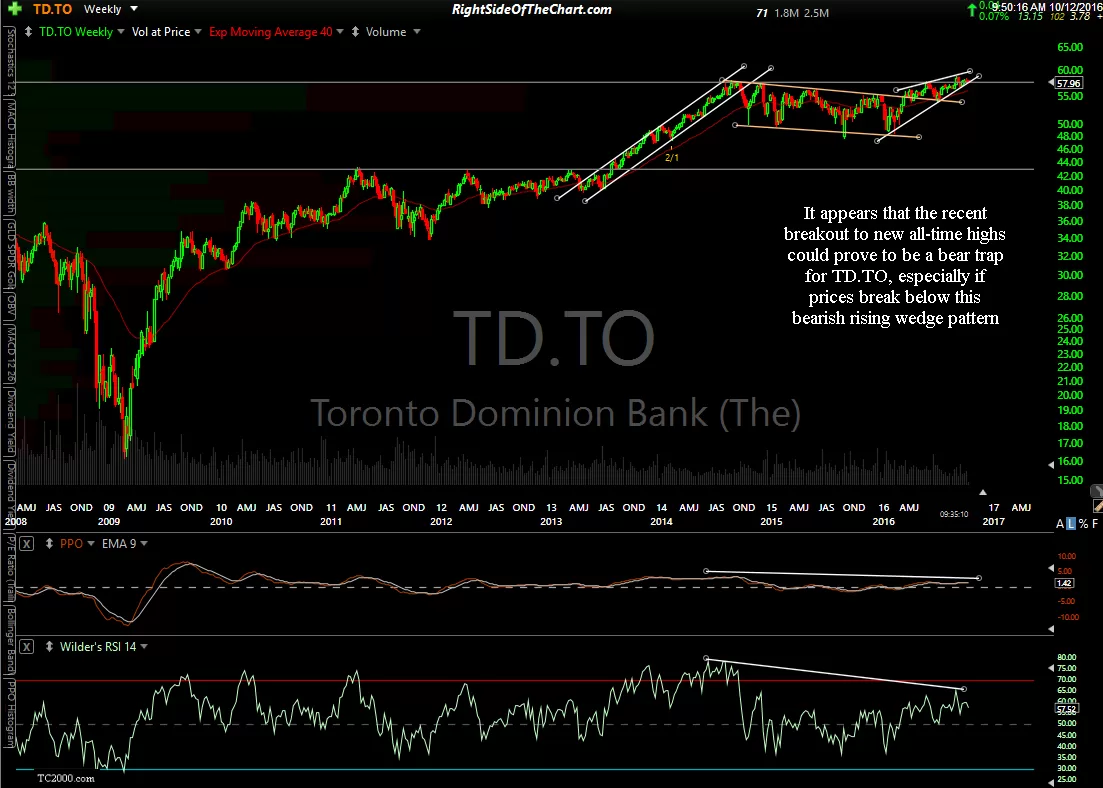
It appears that the recent breakout to new all-time highs could prove to be a bear trap for TD.TO (Toronto Dominion Bank, especially if prices break below this bearish rising wedge pattern. As with RBC, I’d give nearly equal odds of one more thrust higher within the wedge on TD Bank although a breakdown could occur anytime now & would likely be the catalyst for a move down to the 56.50 area.
-

- TD.TO daily Oct 12th
-

- TD.TO weekly Oct 12th
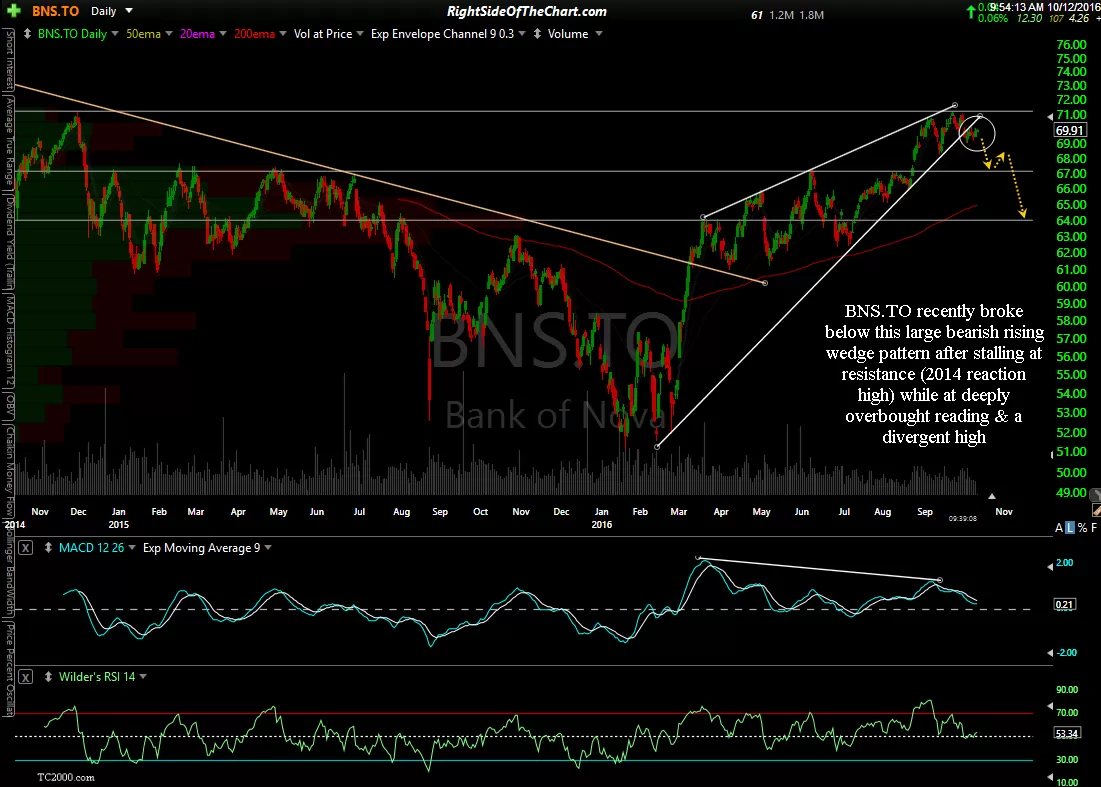
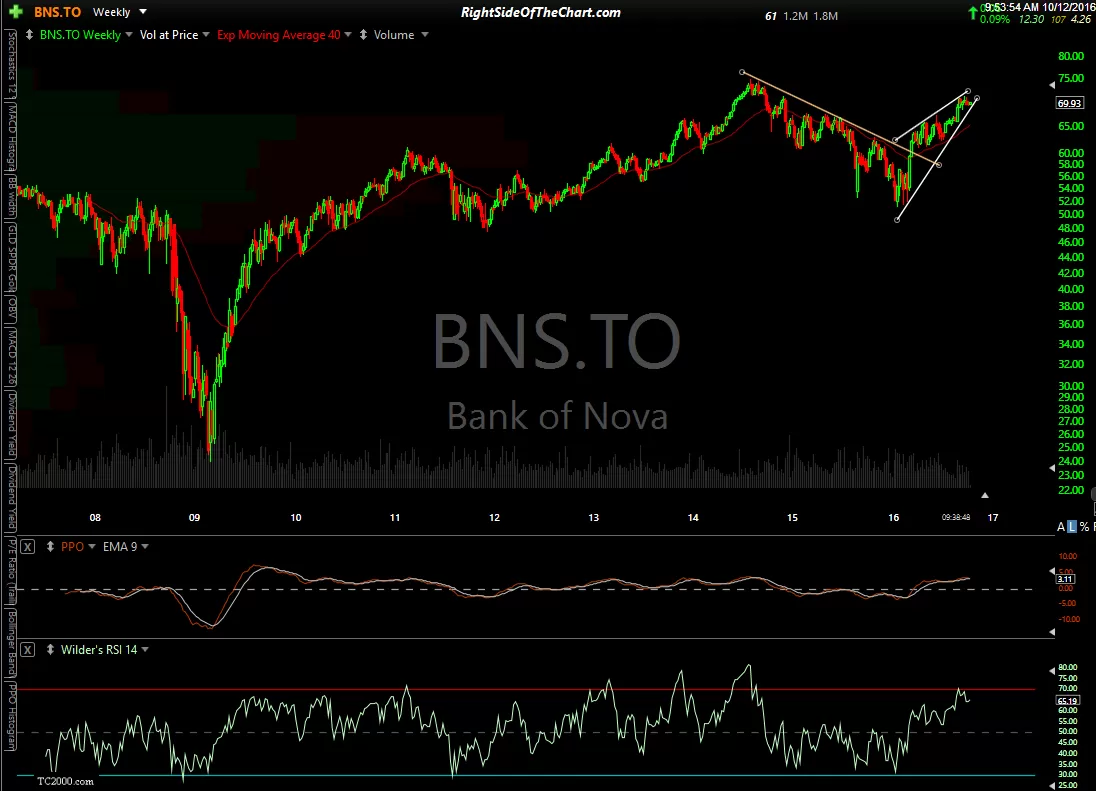
BNS.TO (Bank Of Nova Scotia) recently broke below this large bearish rising wedge pattern after stalling at resistance (2014 reaction high) while at deeply overbought reading & a divergent high.
-

- BNS.TO daily Oct 12th
-

- BNS.TO weekly Oct 12th
Note: The charts above show the shares that trade on the Toronto Stock Exchange (TSX), designated by the “.TO” at the end of the ticker. Each of these Canadian banks also trade on the NYSE (US exchange) under the same tickers (RY, TD & BNS) although there are noticeable differences in the charts between the two. I used the Canadian tickers as there are a large number of Canadian subscriber & visitors of RSOTC & figured that might find this analysis, along with the key support & resistance levels on these charts useful.