
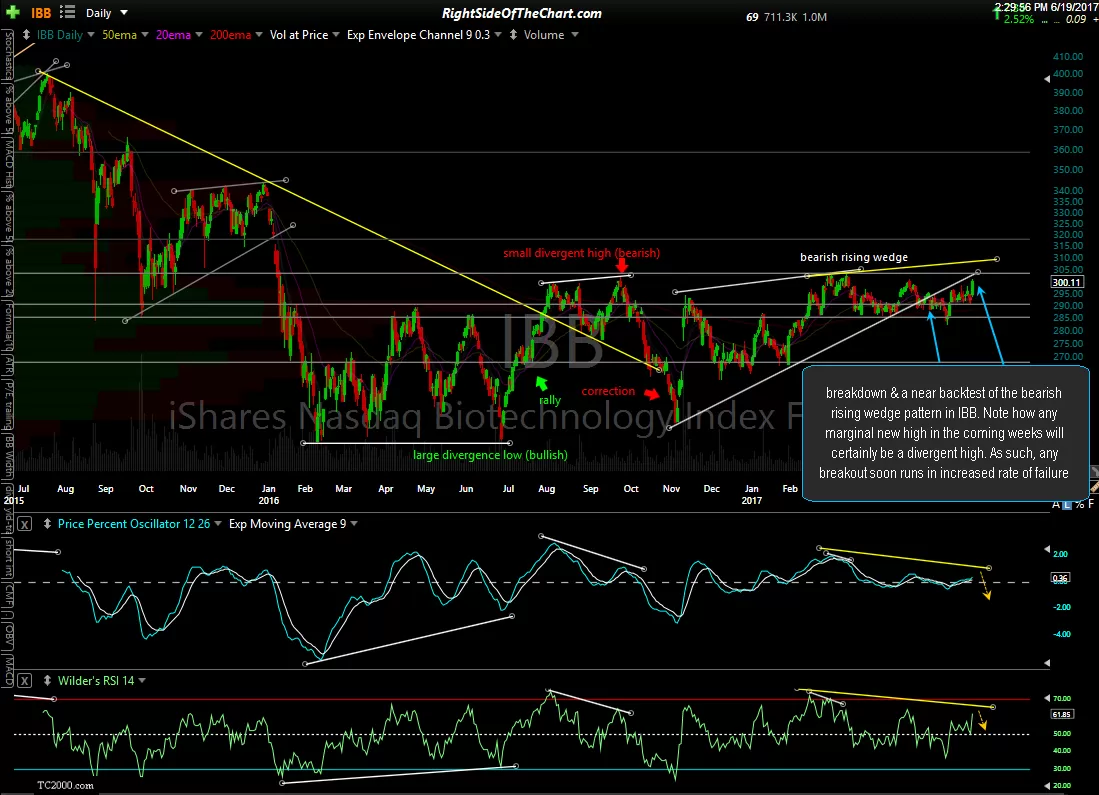
In the first chart below which was posted on Monday, I highlighted the fact that any new high on IBB (Nasdaq Biotech ETF) soon would be a divergent high & so far, that is the case. Yesterday, IBB attempted to breakout above the 303ish resistance level which has capped all advances going back to the fall of 2016 but fell back just below that level shortly before the close. Once again, IBB is making another breakout attempt, trading well above that key resistance level as I type.
-

- IBB daily June 19th
-
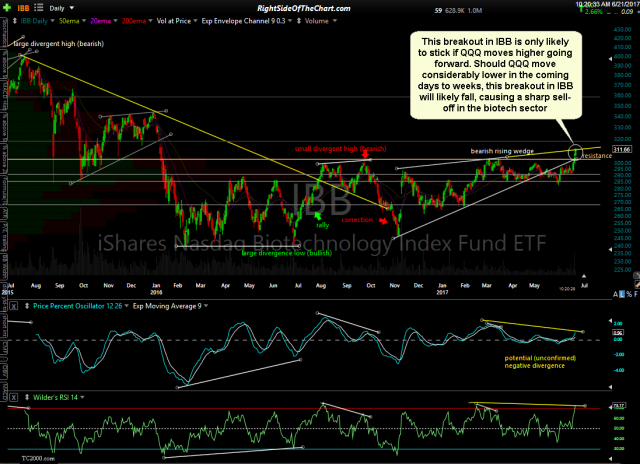
- IBB daily June 21st
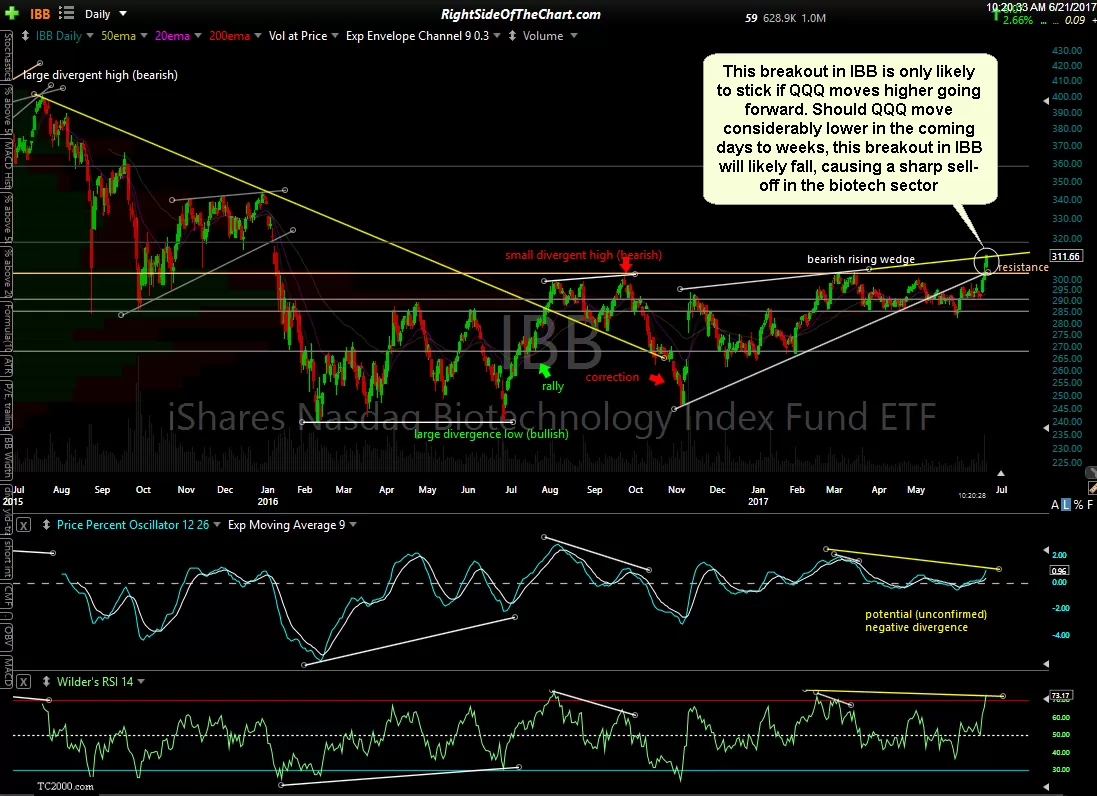
Based on the fact that IBB & QQQ (Nasdaq 100 Index tracking ETF) have an extreme tight historical positive correlation as shown below, a correlation that has recently experienced an unusual but most likely temporary disconnect, this breakout in IBB is only likely to stick if QQQ moves higher going forward. Should QQQ move considerably lower in the coming days to weeks, this breakout in IBB will likely fall, causing a sharp sell-off in the biotech sector.
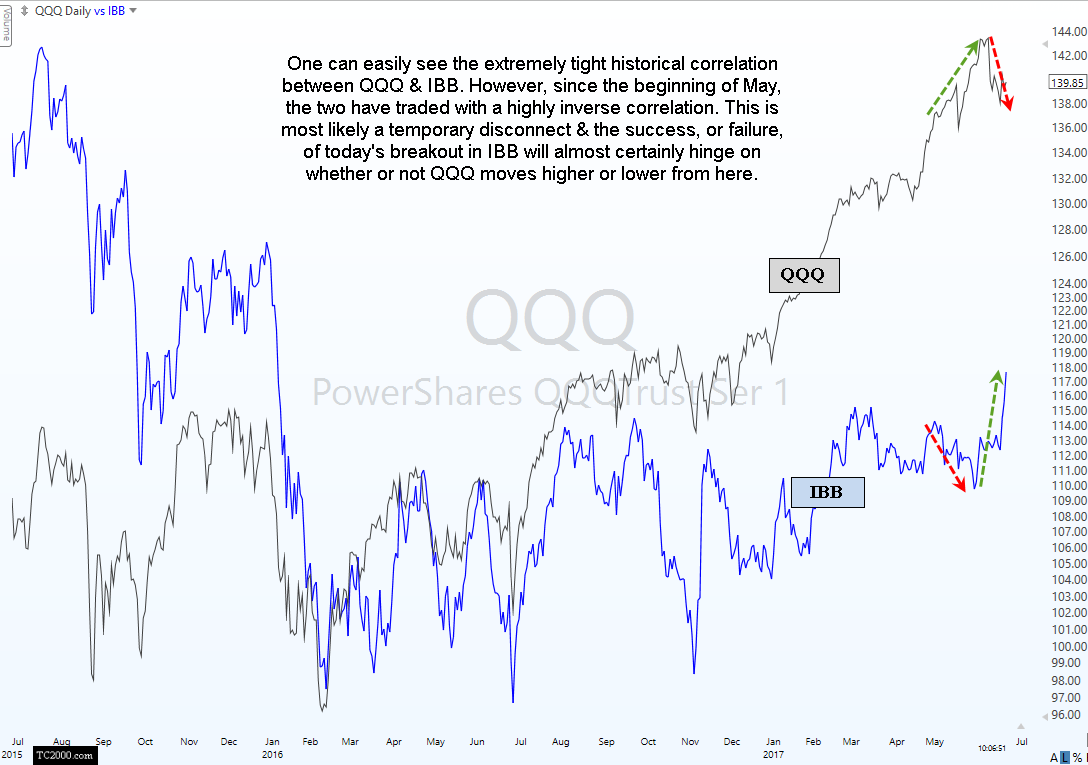
QQQ vs IBB June 21st
The takeaway from this would be that if you are bullish on the near & longer-term outlook for QQQ & believe that the recent breakdown will prove to be fleeting, with the Q’s powering on to new highs & then some in the coming days, weeks & months, then IBB would certainly offer an objective long entry here. On the flip side, if you believe that the recent breakdown in QQQ & the market leading FAAMG stocks was the catalyst for a correction with more downside to come, then one could short IBB here in, with reasonable stops in place, in anticipation that this will prove to be a false breakout, i.e.- bull trap, in the biotech stocks. While the latter would be quite aggressive, a more conventional, higher-probability short entry would be to wait for confirmation that today’s breakout has failed along with a break below the recent lows (~137.50ish) in QQQ.