
This first chart below shows the various stages of a full bull & bear market cycle. Other than the die-hard crypto perma-bulls, I think most would have to agree that the December 2017 blow-off top in Bitcoin marked the bursting of one of the latest in a long history of financial bubbles. While only time will tell whether the 2017 top will go down in history as THE top for the premiere cryptocurrency or only a bump in the road to new highs & beyond at some point in the future, it appears to me that the recent rally, which started earlier this year with something as simple as a breakout above a relatively small (60-min) bullish falling wedge pattern, as posted in the 60-minute chart back in Feb 8th at the time (below), as a long trade setup in the trading room.
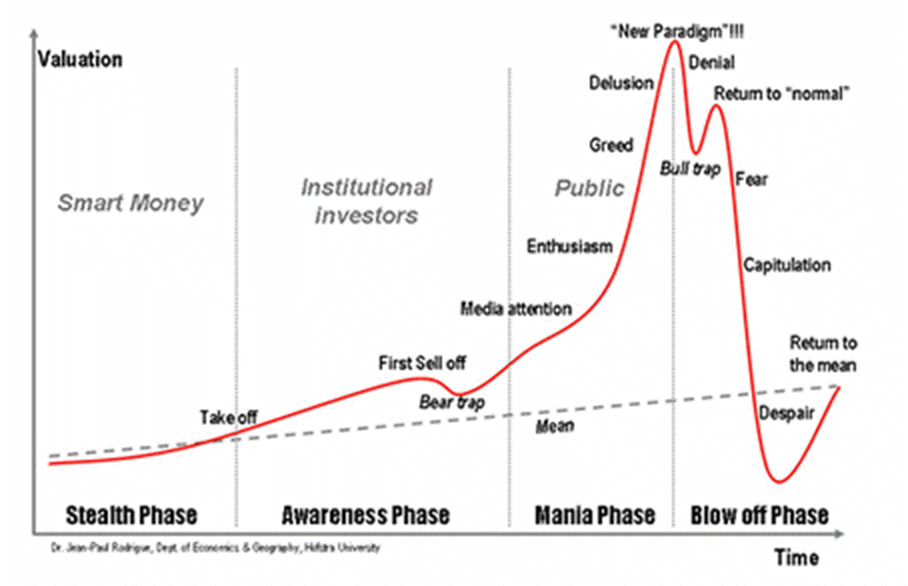
Stages Of A Bear Market
That breakout above the relatively small 60-minute bullish falling wedge followed by the subsequent breakout above the highlighted 3456 resistance level (bottom of a big gap + top of that multi-week basing pattern) proved to be the beginning of a 300% bear market rally. One might immediately question how I can refer to a 300%+ advance as a ‘bear market rally’ to which I would simply say that the old, commonly accepted measure of a bull or bear market being defined as a rise or drop of 20% or more typically & has historically applied to the stock market & not a blanket metric applied to all securities & indexes.
Take natural gas, for example. As one of the most actively traded commodities, natural gas prices are very volatile with single-day gains & losses in excess of 10% not unusual as well as rallies & corrections with larger bull & bear trends easily measuring 30% or more. The extreme daily & multi-week price swings in Bitcoin, of course, make nat gas prices look as stable a 6-month bank CD. My point is that prices swing of any security as well as the micro-trends within a larger, primary trend is completely relative & should be viewed & categorized (as corrections & rallies vs. bull & bear markets) based on the longer-term charts & trend of that particular security & not by any standard definition of a “correction” or “bull/bear market” using a particular measurement (e.g.- 10% for a correction or 20% for a bull or bear market).
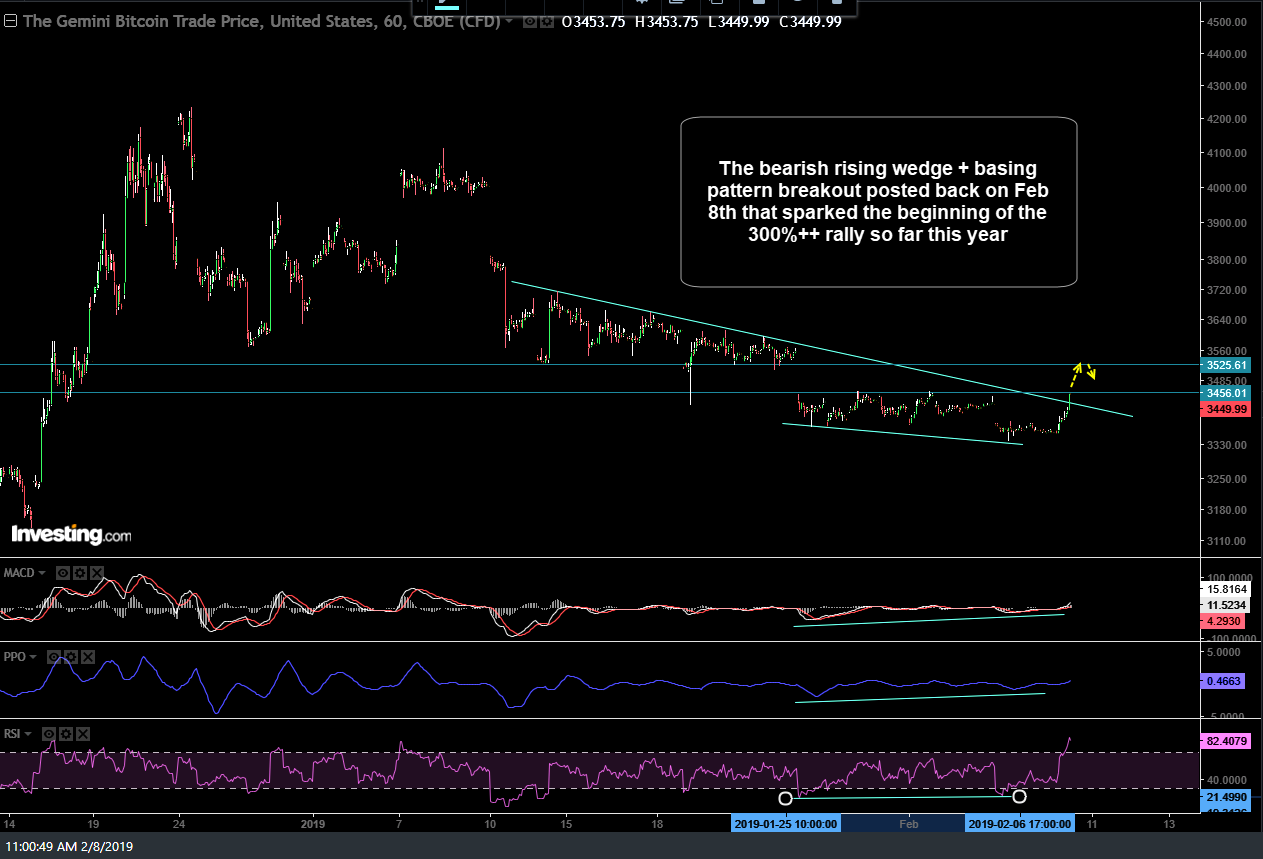
GXBT 60-min Feb 8th
With that being said, the next chart below shows the strong bull market in the tech-heavy Nasdaq Composite of the ’90s which cumminated with a parabolic, blow-off top leading up to the March 2000 top, just as with Bitcoin leading up to the 2017 top. Following the dot.com bubble bursting in early 2000, the Nasdaq plunged 41% over the next several months, followed by a “Return To Normal” rally with a (seemingly) impressive & convincing (at least to the masses) rally of 41% (again, highlighting my point that 40% was technically not a bull market, rather simply a bear market rally within a larger bear market).
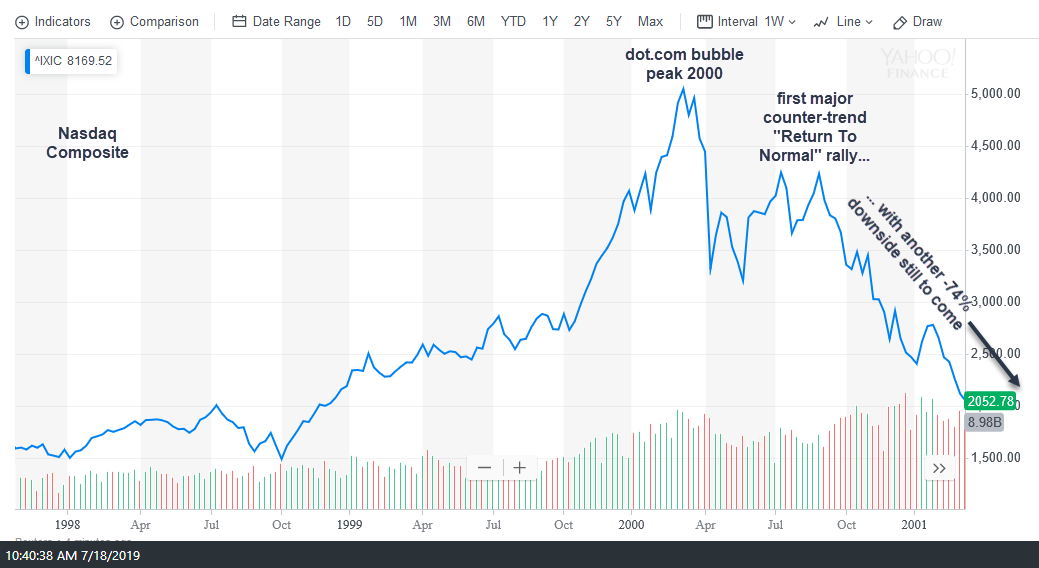
Nasdaq Bubble July 18th
Not unlike today, following the 33% rally off the Dec 24th, 2018 lows, the majority of market partipants were of the mindset that a rally of such magnitude couldn’t possibly mean anything more than the Great Bull Market was still healty & very much alive, with the previous big drop just another great buying opp on the road to new highs & well-beyond. And then, reality (or really the technicals) set in, with the Nasdaq plunging another 74% from the peak of that “return to normal” rally before all the hot air from the dot.com bubble had been fully purged from the market.
While only time will tell if I am correct, it appears to me that Bitcoin, as shown in the chart below, appears to be in a similar posture to the Nasdaq Composite back in mid-2000 following that “return to normal” rally.

BTC-USD Bubble July 18th
On a final note, I’m only attempting to paint the bigger picture with my analysis & comparison above. While my preferred trading proxy for Bitcoin, /GXBT (Bitcoin futures) was recently (and possible permanently, still TBD) eliminated by the CBOE, that leaves /BRR (CME Bitcoin futures) & GBTC (similar to, but not exactly, an ETF that tracks Bitcoin) as my alternative trading proxies.
GBTC recently broke down below this ascending price channel on the daily chart, hit the 12.40ish support, reversed & is currently just shy of backtesting the channel from below with the next objective short entries to come on either a solid break below yesterday’s low of 12.29 (highest probability entry), a backtest of the channel/uptrend line from below or another thrust up to the 17ish resistance level.
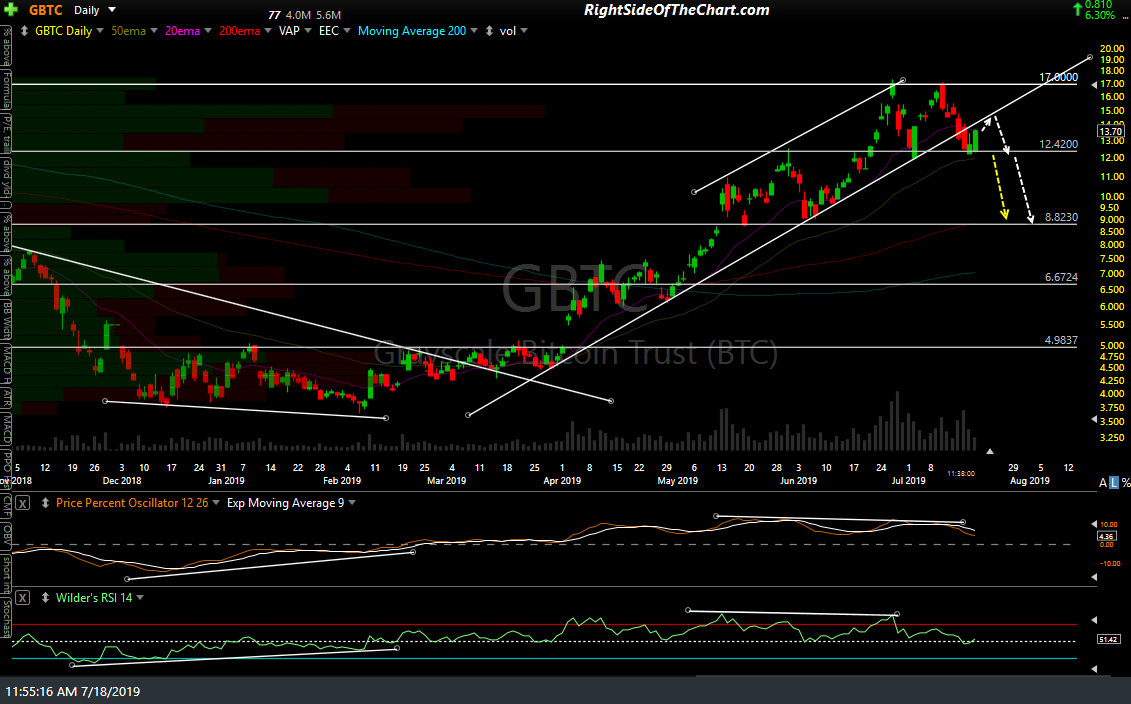
GBTC daily July 18th