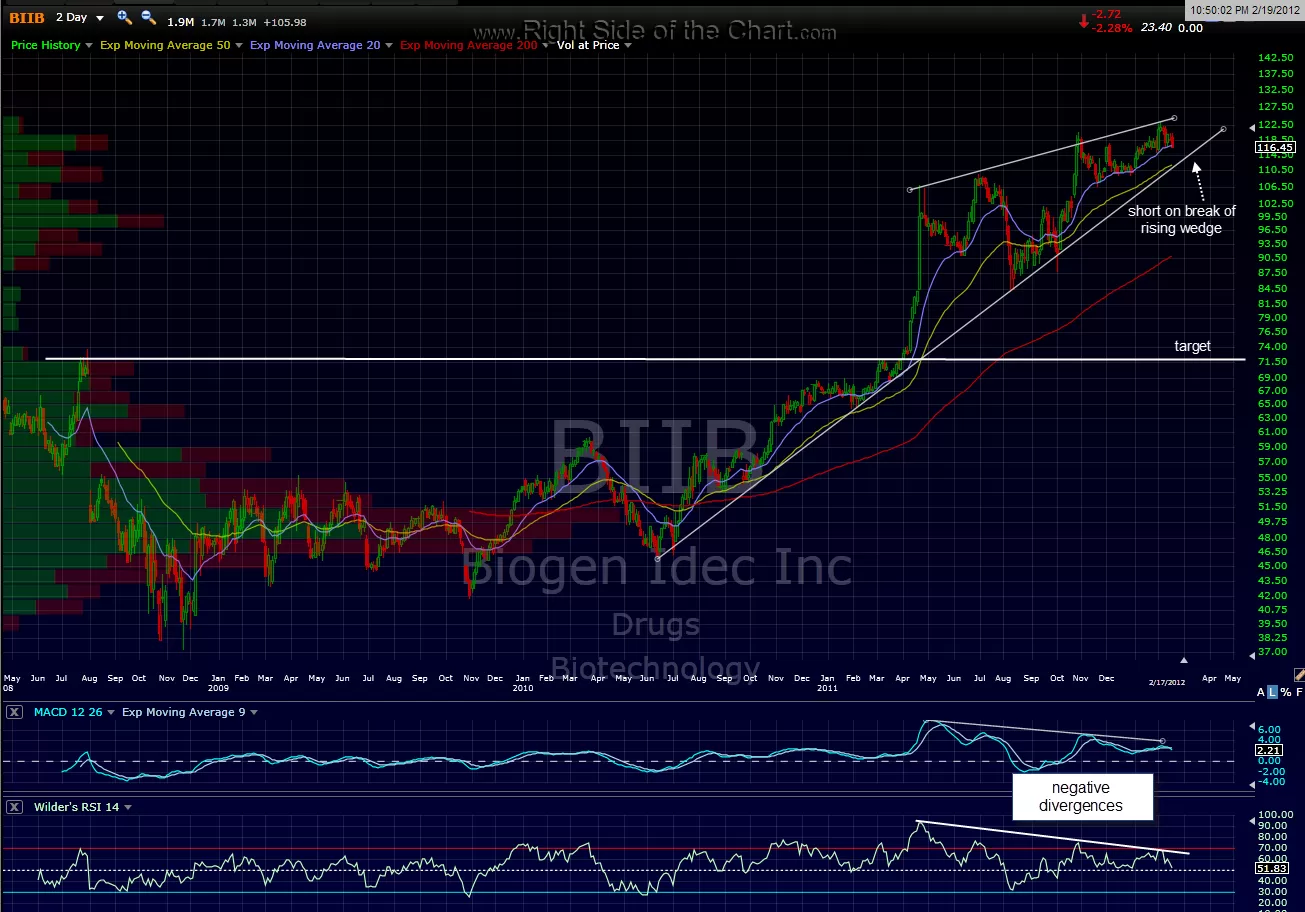
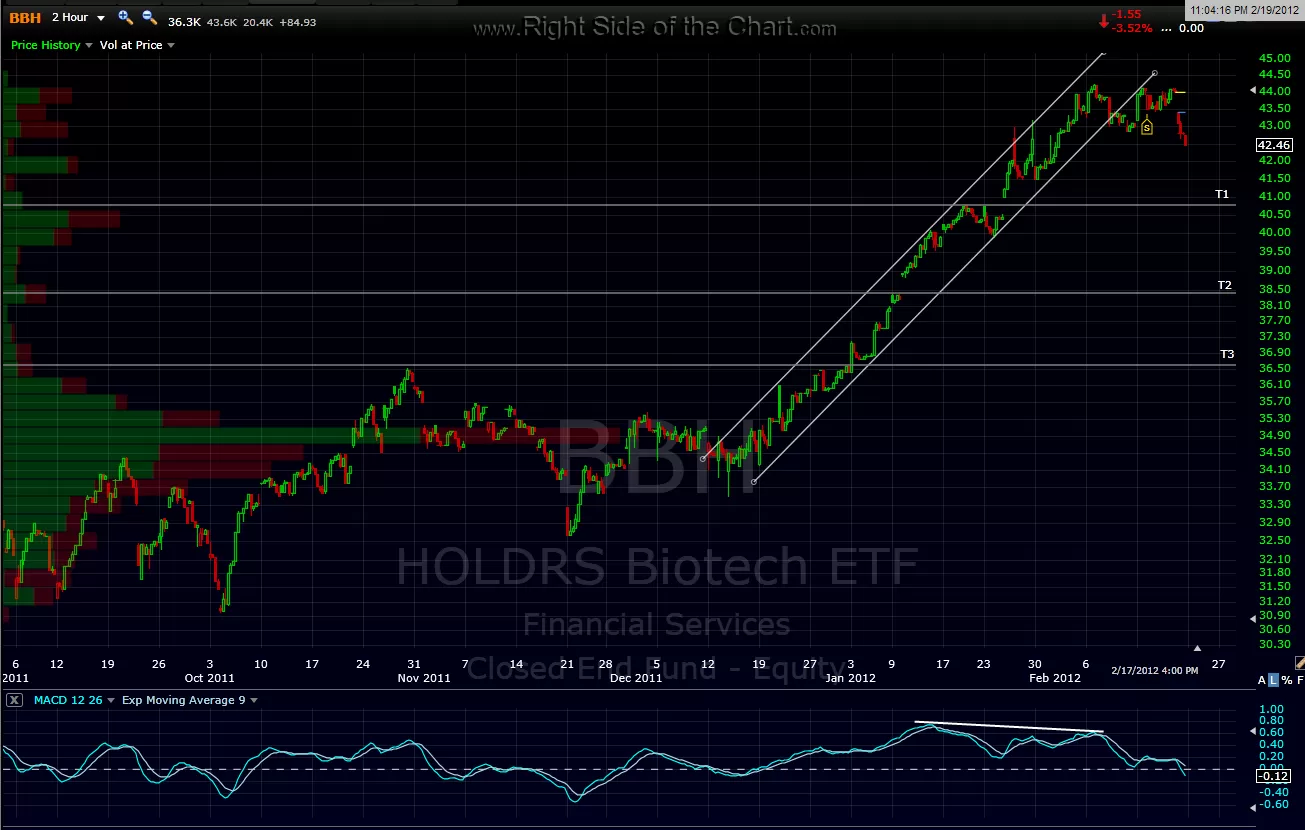
this one has a little more work to do than most set-ups that i post, as i usually try to make my posts timely by posting at or near where i think a pattern might trigger (breakout/breakdown). BIIB is in the biotech sector, which i believe is on the verge of pullback so it could get down to the bottom of that pattern pretty quickly if we get some selling in the sector (IBB, XBI, BBH are some of the better looking biotech etf’s/HOLDRs for a pullback play if you are adverse to shorting individual stocks). XBI has already broken down from a nice 120 min channel and can be entered as a short now (as long as it doesn’t have some crazy gap up or down on tuesday). 2-day chart of BIIB and 60 min chart of XBI below:
EDIT: i mistakenly posted XBI. the 2nd chart and set-up below is BBH (holdrs biotech etf)