
Member @carlyle inquired about the next support level for BGS (B&G Foods Inc) within the trading room. As this stock has the potential to be added as both an official swing trade as well as a Growth & Income Trade idea, with a forward dividend yield of 7.15%, I figured that I would share my analysis on the front page for all members to see.
Essentially, BGS doesn’t have any support below. I say “essentially” because technically speaking, there is support from previous reactions & areas of price consolidation but you have to go back over 6 years and even then, there weren’t many solid support levels from 6-10+ years ago. B&G Foods recently broke down below a key long-term support level around 26.80. In fact, I posted a chart & commentary on the stock in the trading room about a month in response to an inquiry on the stock from another member which can be viewed from clicking this link (Gold level access only). BGS went on to break down below that key support level, followed by an impulsive sell-off which helped to validate that level as significant support. While I can’t make a solid case to go long from viewing the daily chart, there still is potential for the stock to put in a divergent low on the weekly chart, should it reverse soon.
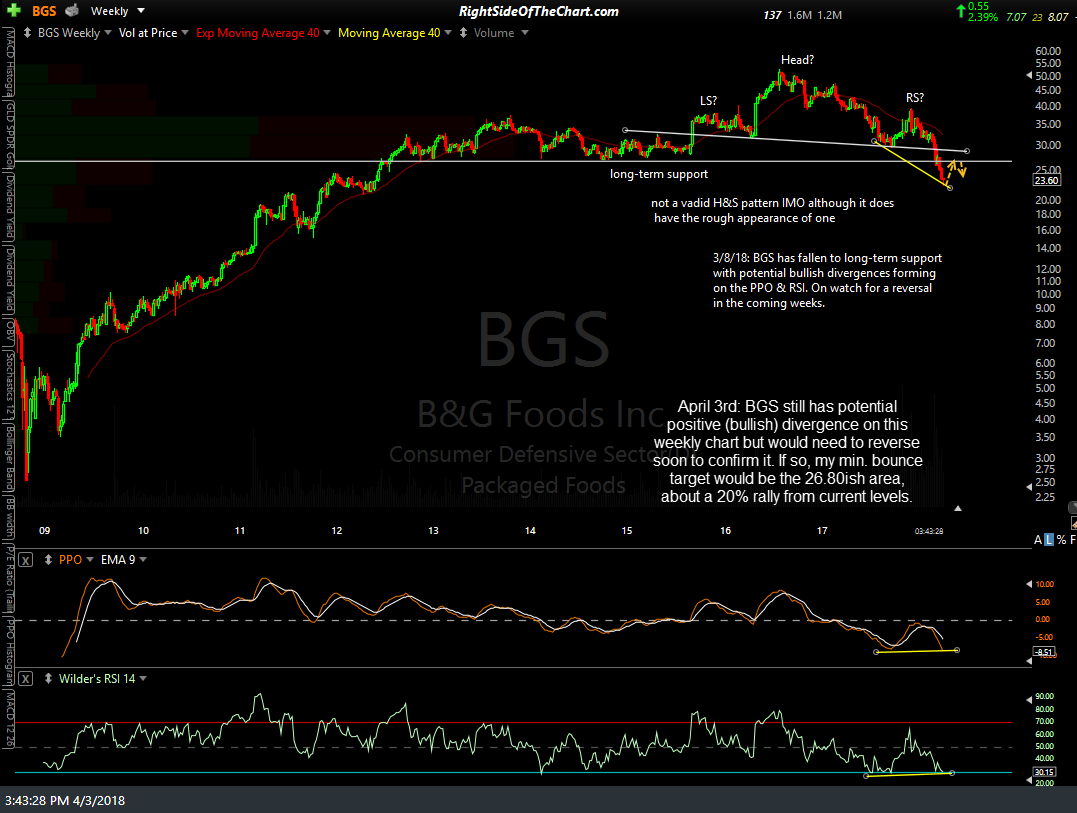
BGS weekly April 3rd
I’m also liking what I’m seeing on the 60-minute chart: A bullish falling wedge confirmed with positive divergence plus some impulsive buying today on increased volume. The levels on the 60-minute chart below are resistance levels that can act as potential price targets. Best to set your sell limit orders slightly below the actual resistance level(s) that you are targeting if you take it & if I decide to add this as an official trade, I will list specific price targets along with the entry criterion (or criteria) along with the suggeted stop & beta-adjusted position size.
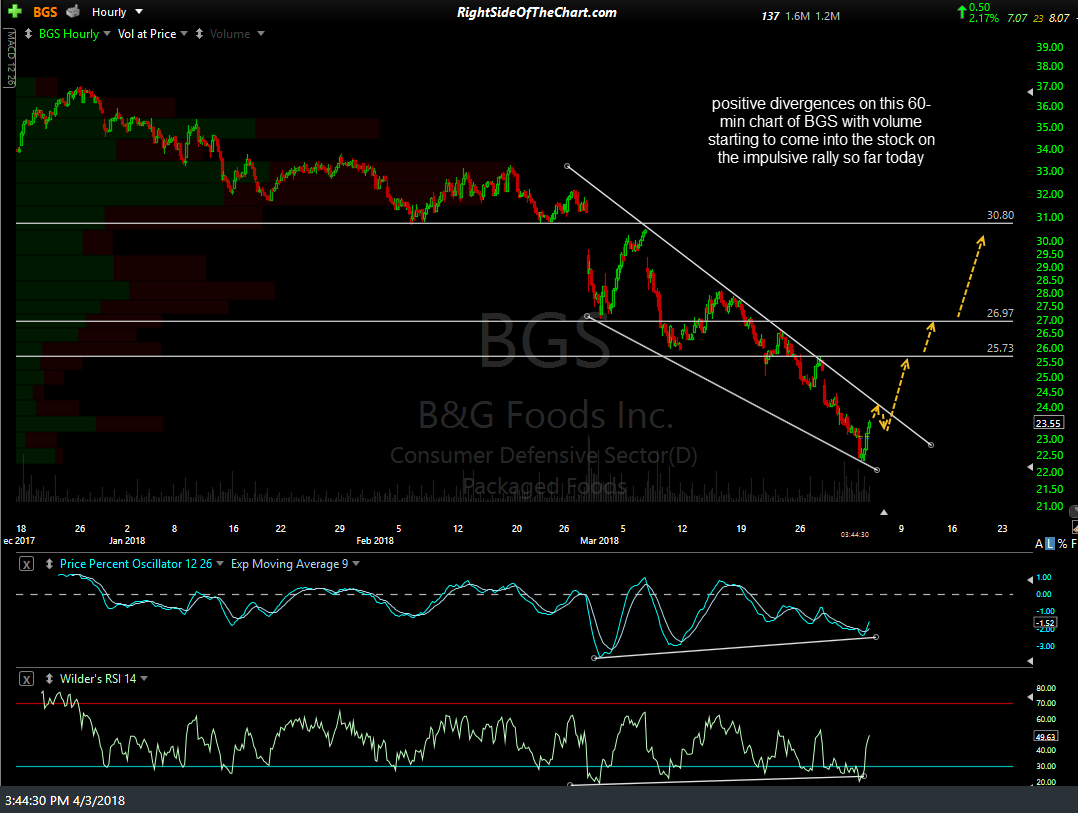
BGS 60-min April 3rd
If the stock holds up tomorrow, an aggressive entry for a “catch-a-falling-knife” trade can be taken within the wedge with a stop placed below the recent lows or one could wait until a breakout above the falling wedge pattern to initiate a position or add to a partial position taken here. Besides the aggressive nature of buying a stock in a clear & powerful downtrend with little evidence of a reversal & no evidence of a bottom at all, going long a stock within a falling wedge pattern on the anticipation that it will go on to break out above the pattern entails risking an increased chance that the trade will not pan out (i.e.- will be stopped out for a loss) but on the flip-side, provides a more favorable entry price vs. waiting for a breakout above the downtrend line/top of the wedge, which is about 2% above where the stock closed today shortly after these screenshots were taken.