
Member @Ruben requested a chart update on BA (Boeing Co.). BA is one of the top components of ITA which is the the IShares Dow Jones US Aerospace & Defense Index Fund ETF. In the March 3rd post titled Are The Defense Stocks A Buy?, the bearish case for the defense sector, including my scenario for ITA was made including the first chart below.
-

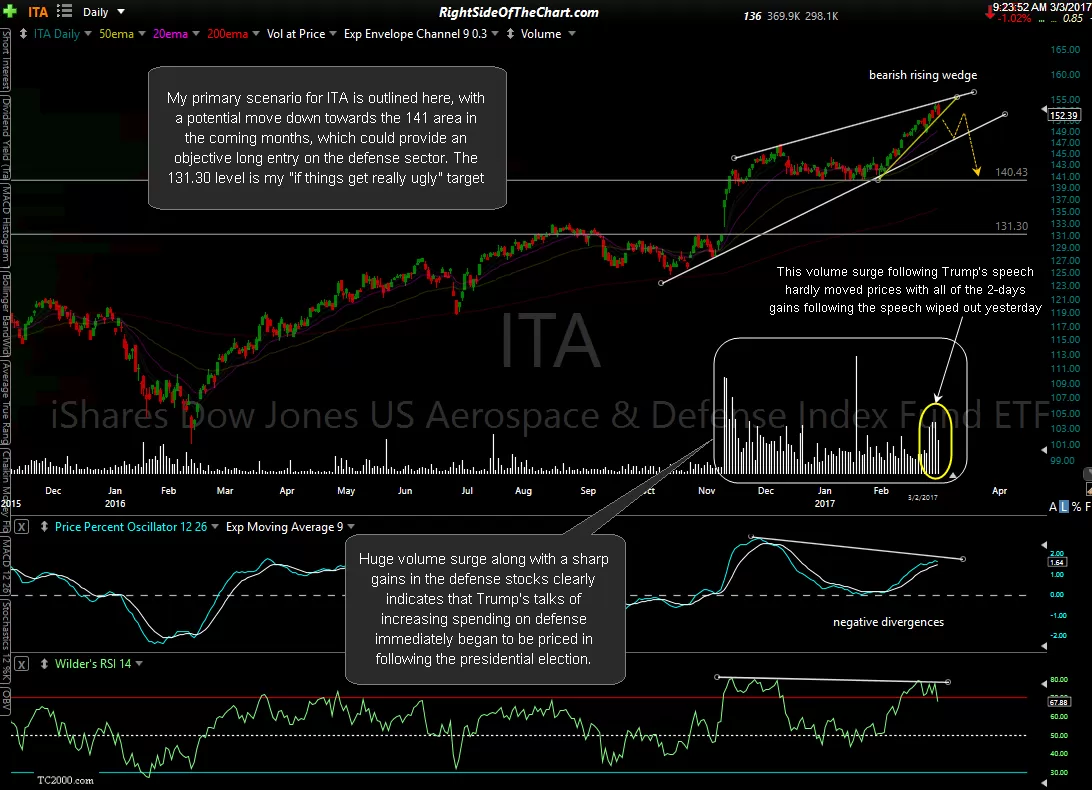
- ITA daily March 2rd close
-

- ITA daily March 27th
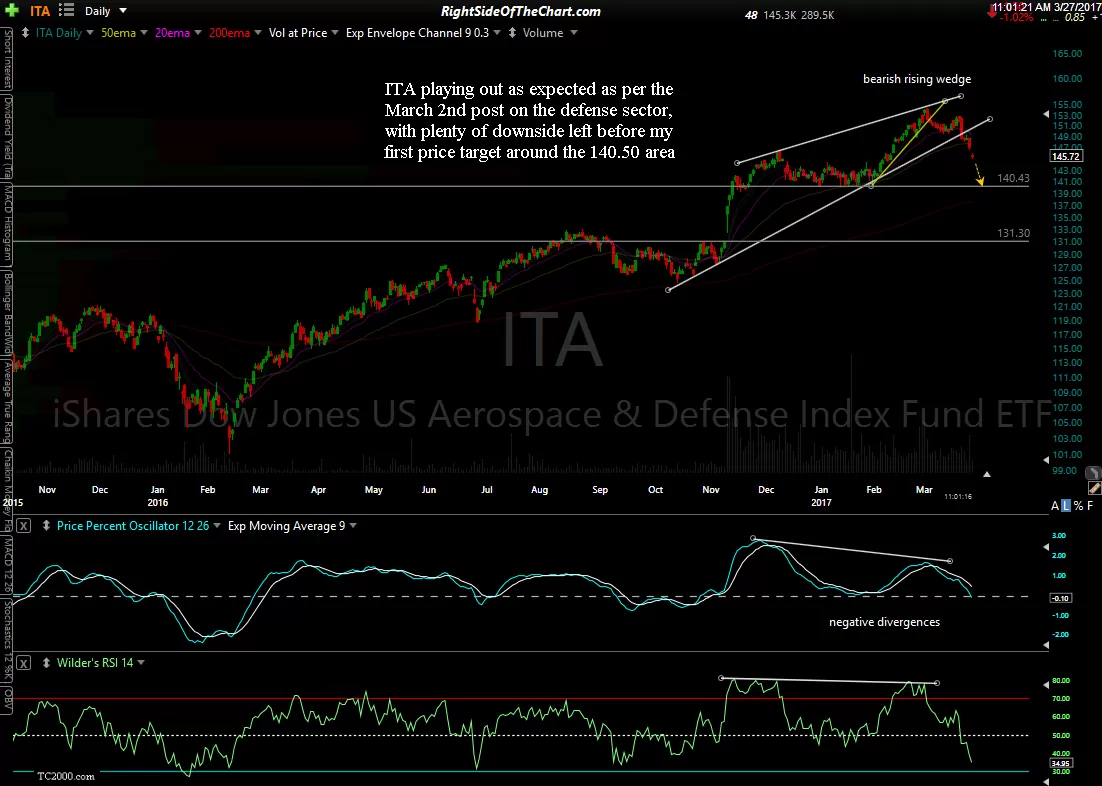
The second chart is the updated chart of ITA illustrating how the aerospace & defensive sector has pretty much followed that projected path, going on to first break below the yellow minor uptrend line (triggering a sell signal), followed by an initial thrust down, a reaction & a subsequent thrust lower with an impulsive breakdown below the bearish rising wedge recently. That breakdown opens the door to a move down towards the 141 area (actual support at 140.43), which would equate to another 3.72% drop in addition to the 4.3% or so that the sector has already fallen since that post a few weeks ago.
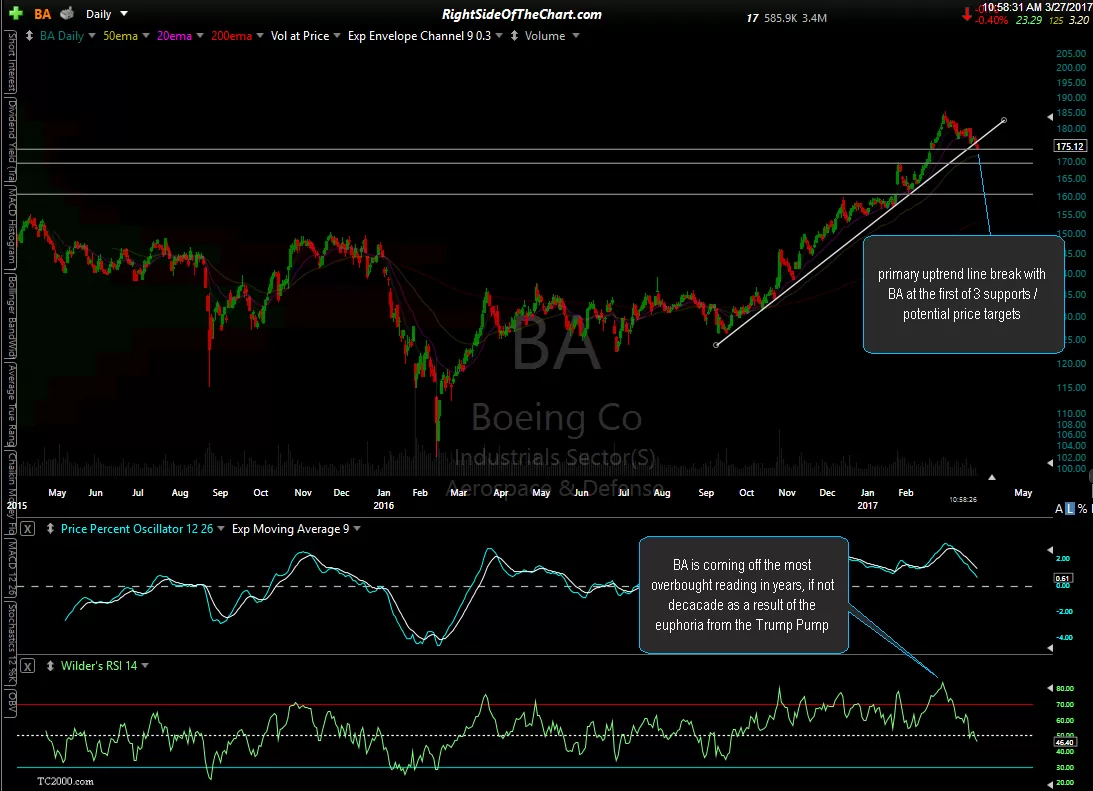
Regarding BA, the first chart below is a daily chart highlighting the recent extreme overbought conditions unarguably a result of the market (over-) pricing in what is likely the most optimistic fundamental boost from any potential boost in defensive spending that the Trump administration manages to push through (and so far their track record on accomplishing what they’ve set out to do has been less than stellar). That daily chart also highlights the recent breakdown below the primary uptrend line off the Sept ’16 lows, a clearly bearish technical event.
-

- BA daily March 27th
-

- BA 60-min March 27th
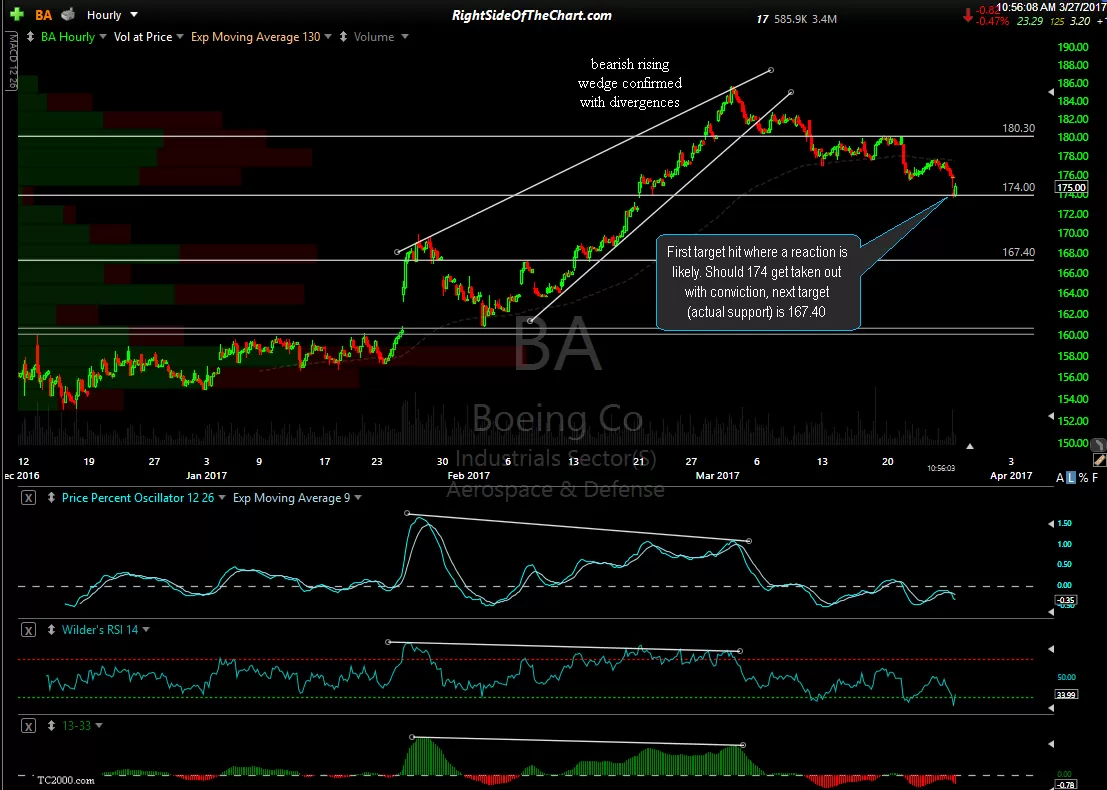
Zooming down to the 60-minute chart, we can see that following the recent breakdown below the bearish rising wedge pattern, BA just hit my first target of 174.00 where at least a minor reaction is likely. Should the 174 support level get taken out with conviction, which I do expect in time, that would open the door to a move down to the 167.40 support level.