here’s a nice, potential long-term trade idea passed along to me by “The Stock Fox”, an excellent resource for gold and silver stocks. click here to see their charts & notes on the trade and i’ve posted my take on the charts below.
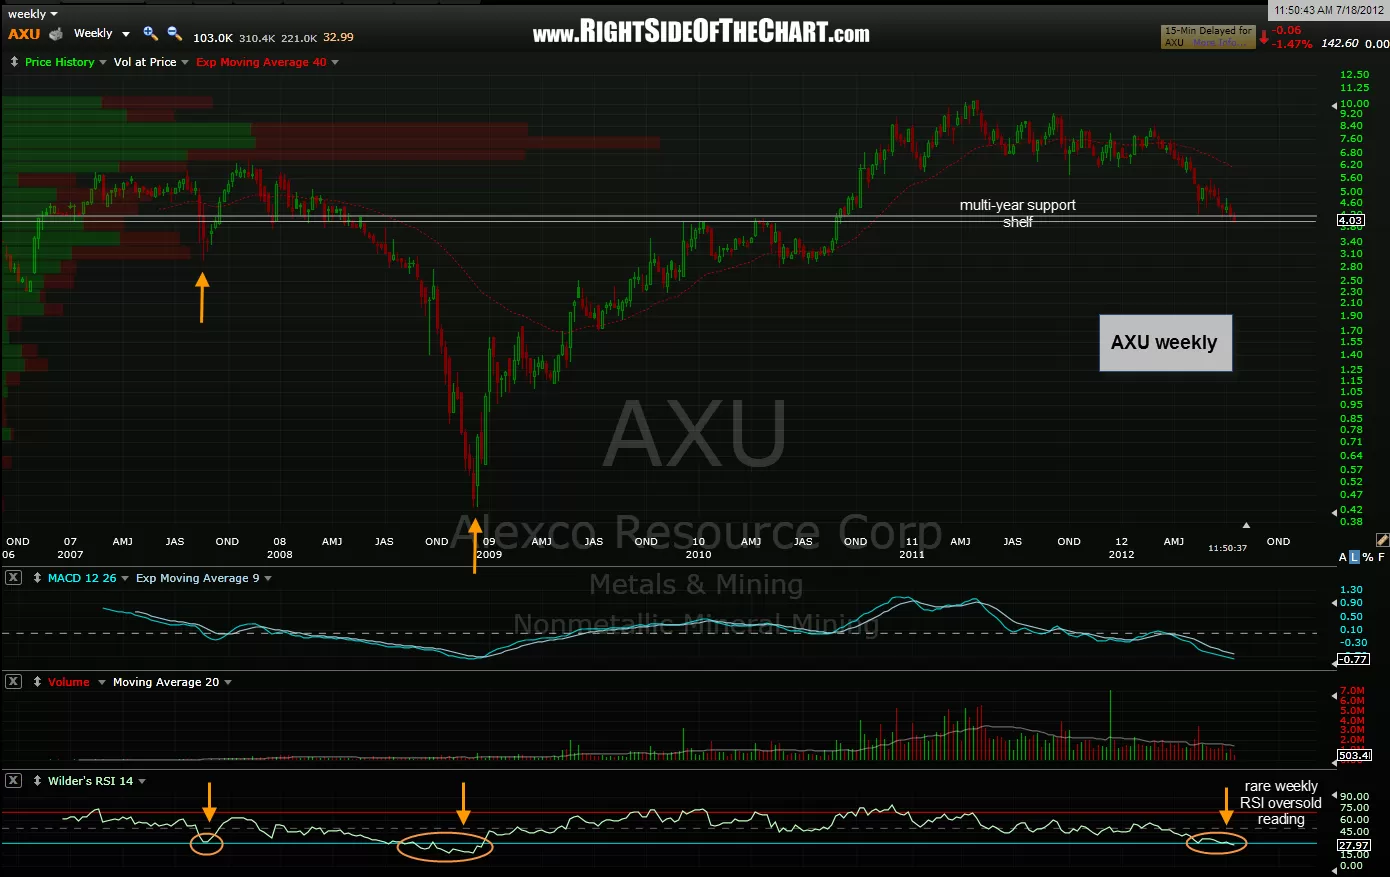
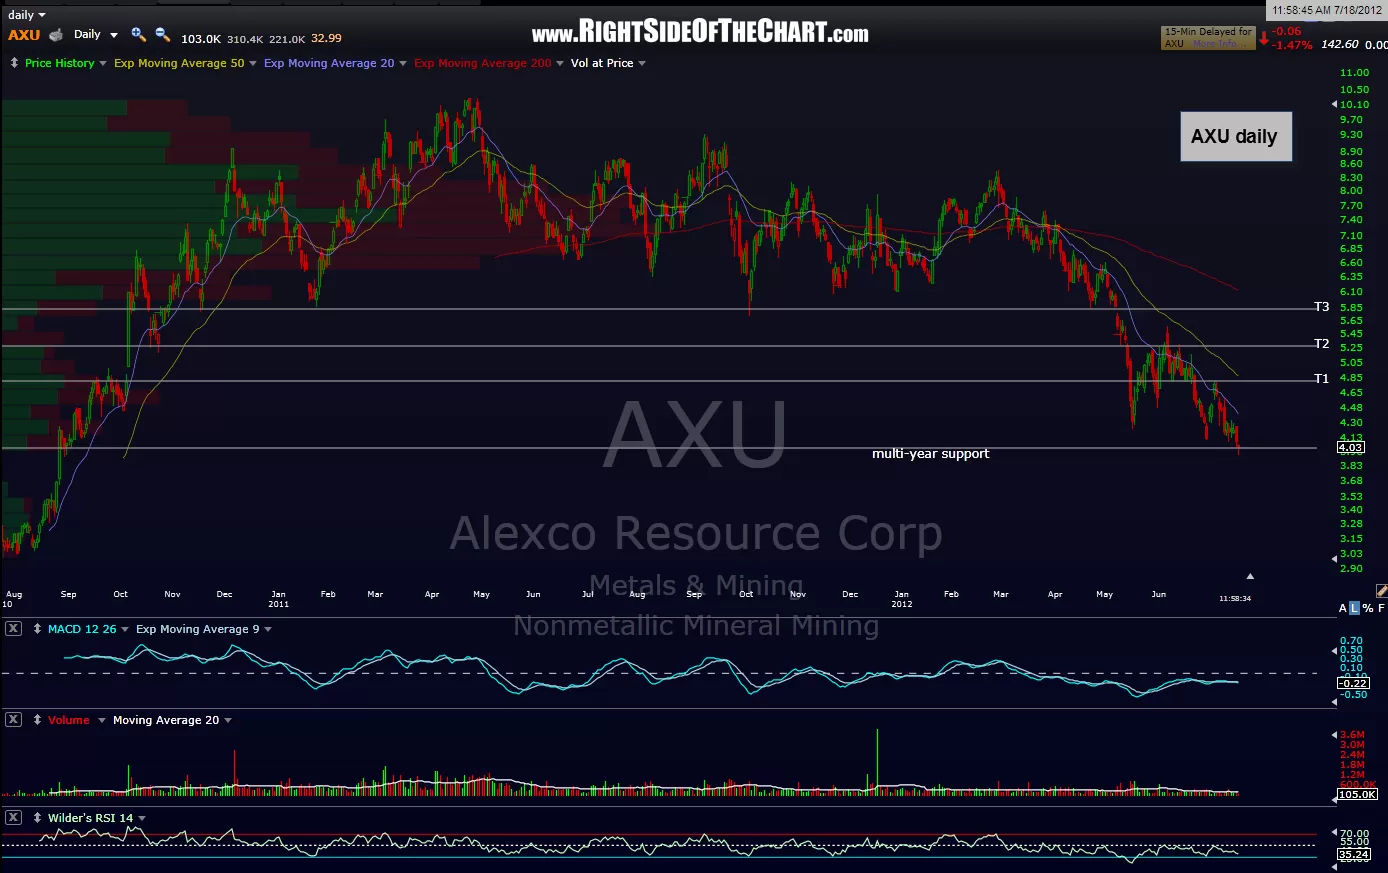
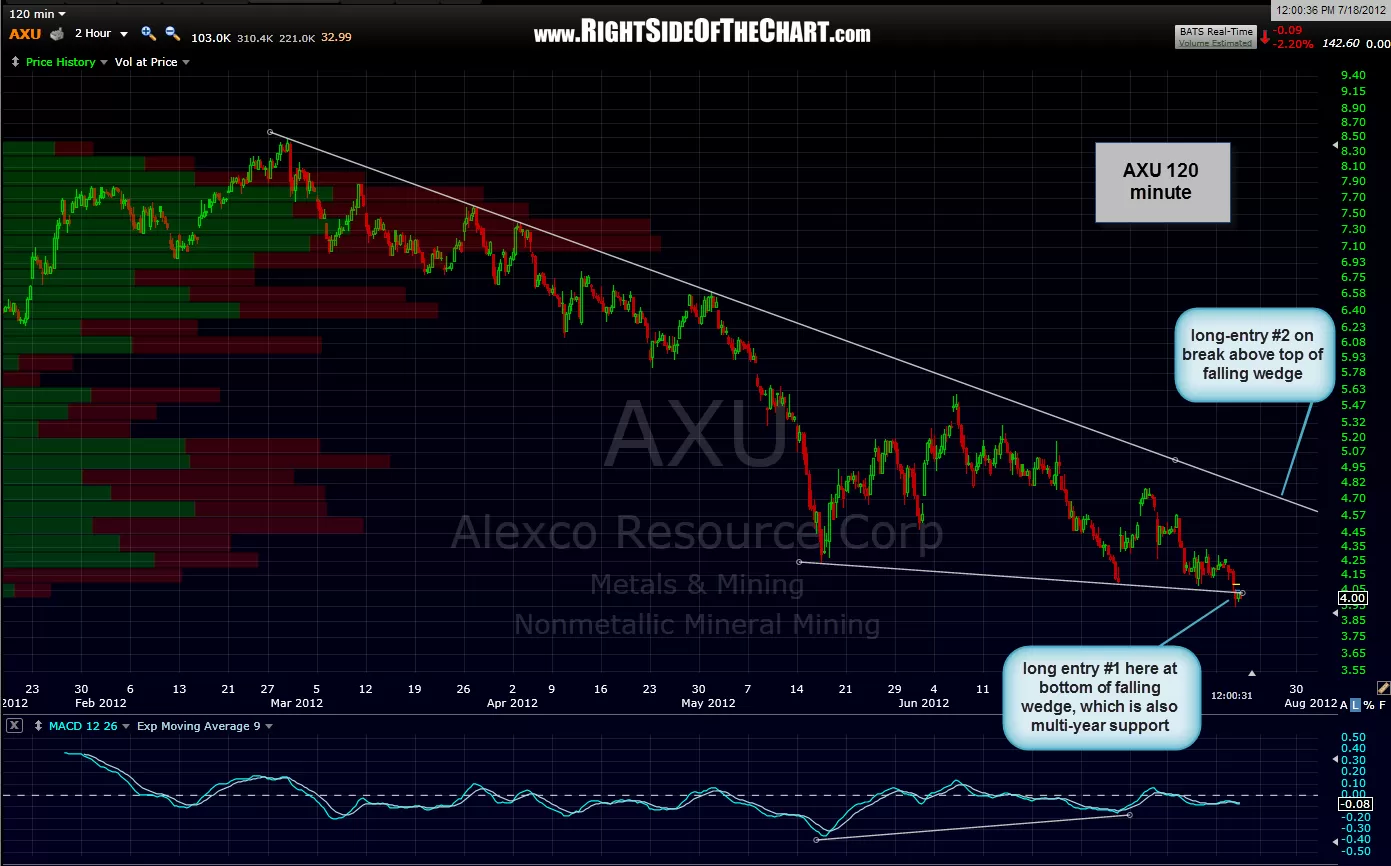
essentially, AXU looks like an objective long entry around current levels as it has fallen to the bottom of both a multi-year support level as well as the bottom of the wedge shown on this 120 minute chart. as this is a potential bottoming play, one might consider beginning to scale in around current levels with the next objective buy point on a break above the top of the 120 minute falling wedge (or daily downtrend line). if you plan to enter or scale in for a potential long-term swing trade or investment, then you might keep your initial position size light as to allow for a little wiggle-room on your stops, which would be on a solid weekly candlestick close below that support line. 120 min, daily and weekly charts below (targets shown on daily chart):