
UNG (Natural Gas ETF) is a good example of the benefits of swing trading vs. investing. UNG was recently added as a long swing trade based off the 60-minute time frame with the trade was confirmed by bullish developments on the daily charts of UNG & $NATGAS (natural gas spot price). As the 60-minute chart below highlights, we were able to milk the bulk of the gains following the recent breakout above the 60-minute bullish falling wedge pattern & with the help of that amazing thing we call technical analysis, we were able to book profits within mere basis points of the end of that run and step aside with our profits & original capital safely in hand while UNG has traded in a sideways, go-nowhere range over the last month since then.
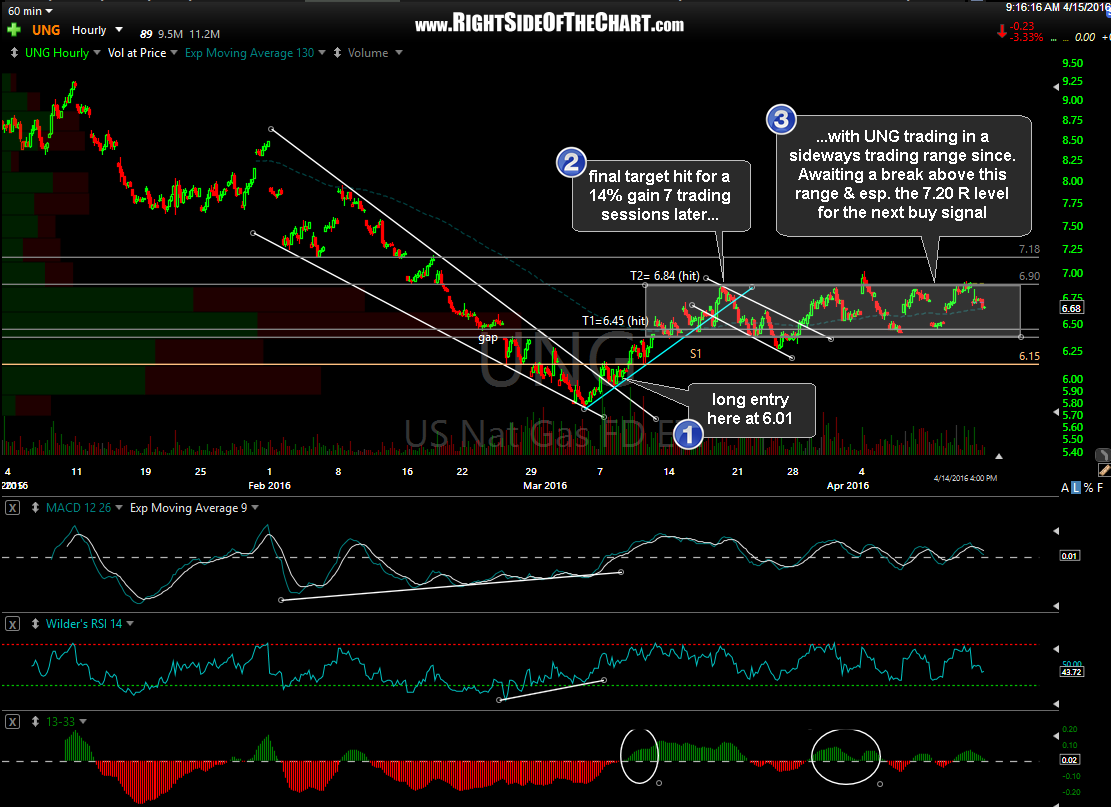
UNG 60-minute April 15th
Zooming out to the daily time frame, while a break above the 7.20 would trigger a buy signal & could come soon (blue arrow), I’m slightly leaning towards the orange scenario of one more thrust down inside the wedge before a lasting breakout. Green resistance levels are my primary targets with the white lines as minor resistance areas along the way.
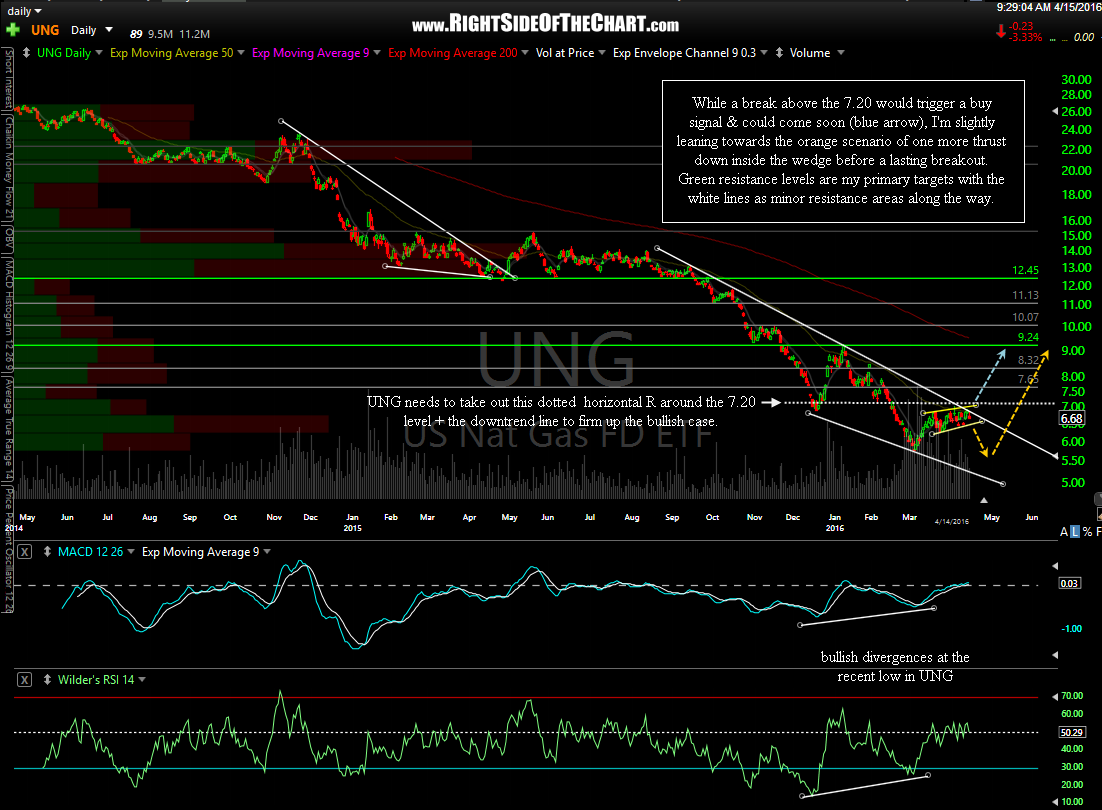
UNG daily April 15th
I wanted to get this charts out ahead of time in case my alternative scenario (a break over 7.20 sooner than later) happens to occur before I can post an update, although I don’t see the likelihood of that happening in too soon as UNG has opened lower & is trading down towards the bottom of the highlighted trading range on the 60-minute chart above (note- that chart was made in pre-market & only reflects through yesterday’s close). Bottom line, I am slightly leaning towards some more downside in UNG in the near-term but it still appears that natural gas is at or near a possible lasting bottom of the vicious bear market that began nearly 8 years ago with the 2008 highs.