
AAPL (Apple Inc.) is currently poised to close red for the 3rd day in a row. Consensus from yesterday’s dog & pony show seems to be mostly negative from what I’ve read, with a lot of comments about how they’ve pretty much run out of ideas for innovative new products & are now resorting to things such as streaming TV (a little late to a very crowded party, IMO) & a news-feed aggregation service using the content of others (also nothing new).

AAPL weekly March 26th
Fundamentals aside, the weekly chart looks like nothing more than a bear market rally in AAPL so far with the stock slightly overshooting the 40-week EMA (which does a great job of defining bull & bear trends in the stock), as it has on all previous initial bear market rallies before reversing & falling back below it followed by the next major leg down in the stock. While I realize this nothing short of heresy to Apple bulls (which accounts for the vast majority of market participants, devoted Apple fans and probably over 90% of those reading this… sorry, but I call ’em as I see ’em), here are my price targets & projected path for the stock which entails a drop of another 50% from current levels which follows the nearly 40% drop on the initial leg down off the bull market top back in Oct 2018. Despite the seeming impressive rally off the Dec lows (as all bear market rallies are impressive & do a great job of convincing the masses that the worst is over), AAPL is still trading down 20% off that Oct 2018 bull market top, still entrenched in a bear market by most technical metrics.
AAPL daily March 26th
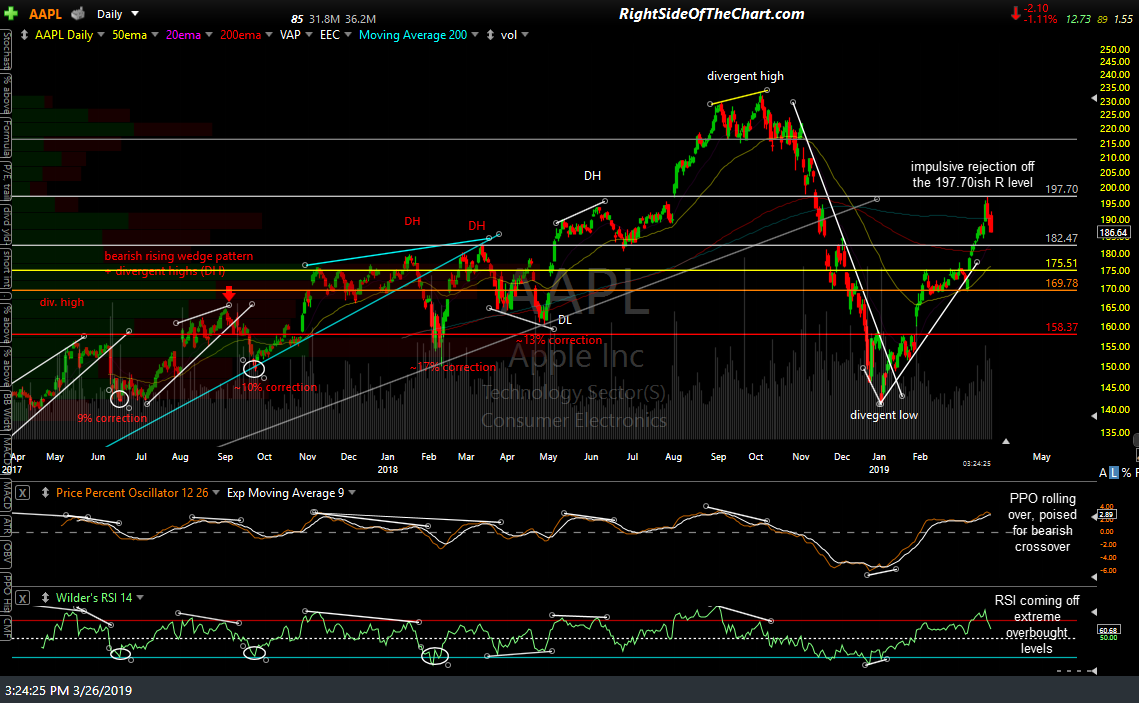
While we don’t have any high-probability sell signals on the stock at this time, AAPL did reverse impulsively off the initial tag of the 197.70ish resistance level on Friday, which is roughly the top of the very large & technically significant gap from Aug 1, 2018. Also, note that the RSI is rolling over off deeply overbought levels while the PPO has also turned down & is currently poised to make a bearish crossover on any more downside in the stock on the daily chart above. I’ve colored coded the support levels below similar to those that I recently added to the SPY daily chart, with my minimum pullback target in white followed by additional support levels, each of which are potential targets although if/as each of those levels are taken out, the odds for a test & undercut of the December lows increases substantially.
While not my preferred scenario, the bullish scenario would have the stock continuing higher, ideally after a decent correction to at least my first or second targets on the daily chart, which would help to alliviate the overbought conditions & pave the way for the next sustained thrust higher. If so, the stock would still have to content with the 197.70ish resistance level as well as the more significant 261.50ish level (uppermost horizontal line on the daily chart). Doing so would help put some distance between AAPL & its key 40-week moving average & increase the odds that the bear market off the 2018 highs did indeed end with the ~39% drop into the December lows. Until & unless that happens, I continue to view the recent rally in Apple as a typical bear market rally which may have already run its full course with Friday’s high.