
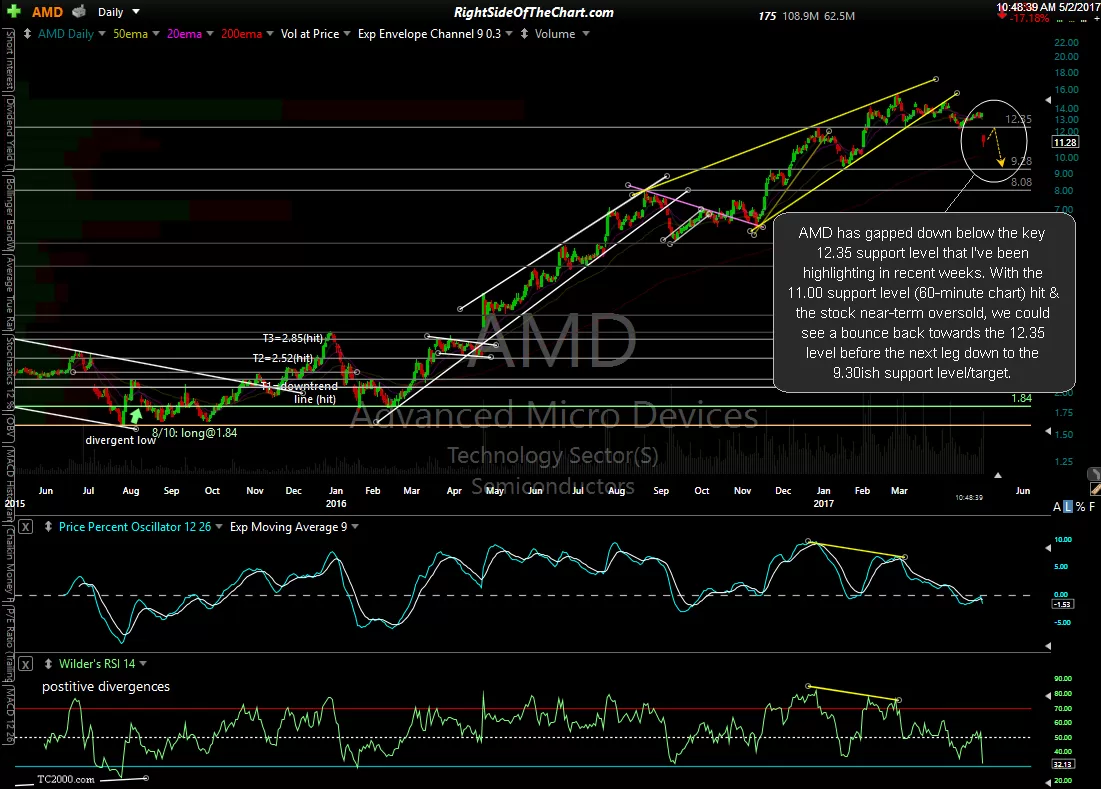
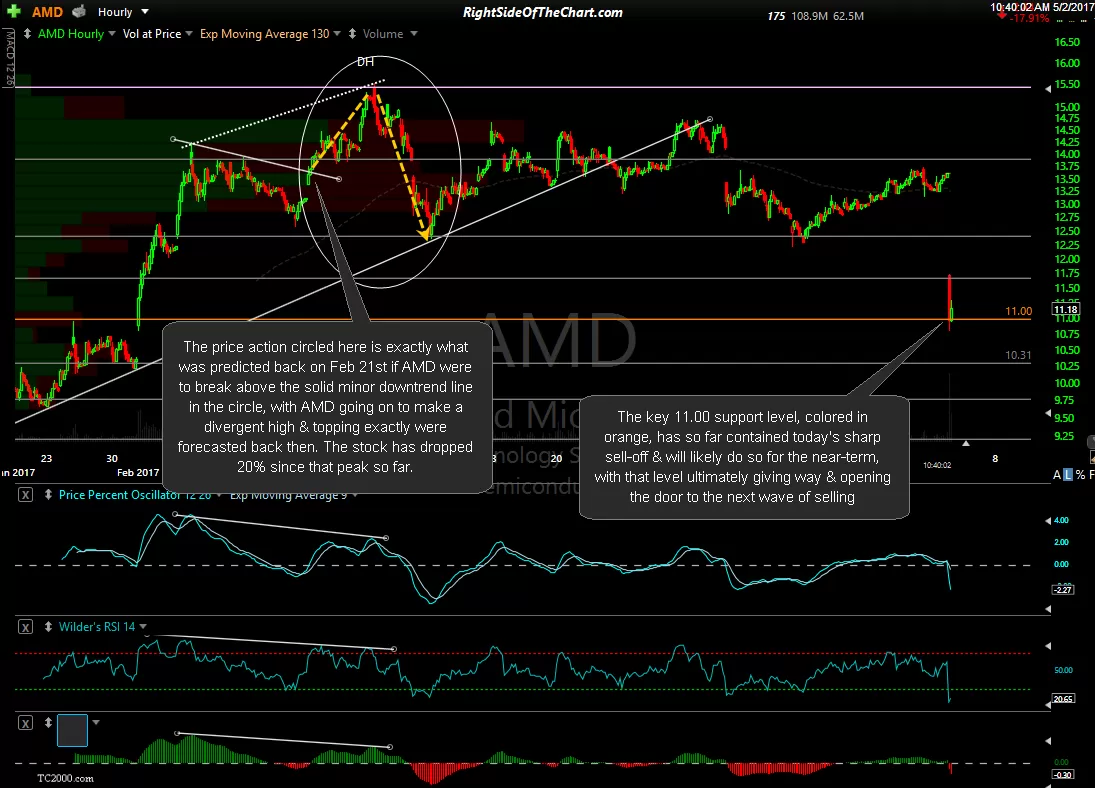
AMD (Advanced Micro Devices) has gapped down below the key 12.35 support level that I’ve been highlighting in recent weeks. With the 11.00 support level (60-minute chart) hit & the stock near-term oversold, we could see a bounce back towards the 12.35 level before the next leg down to the 9.30ish support level/target. Below are some of the daily charts of AMD recently posted on the front page or within the trading room.
-
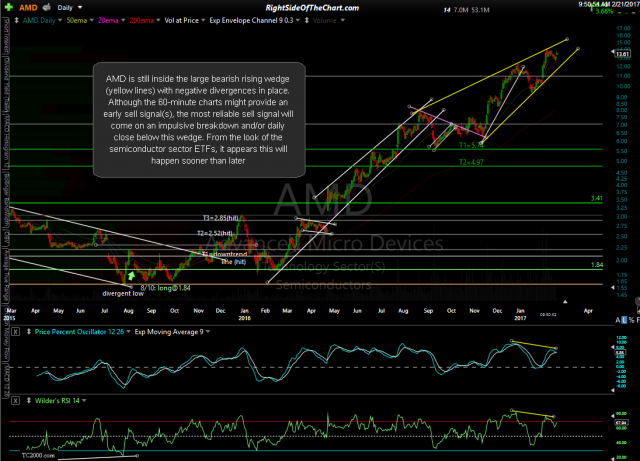
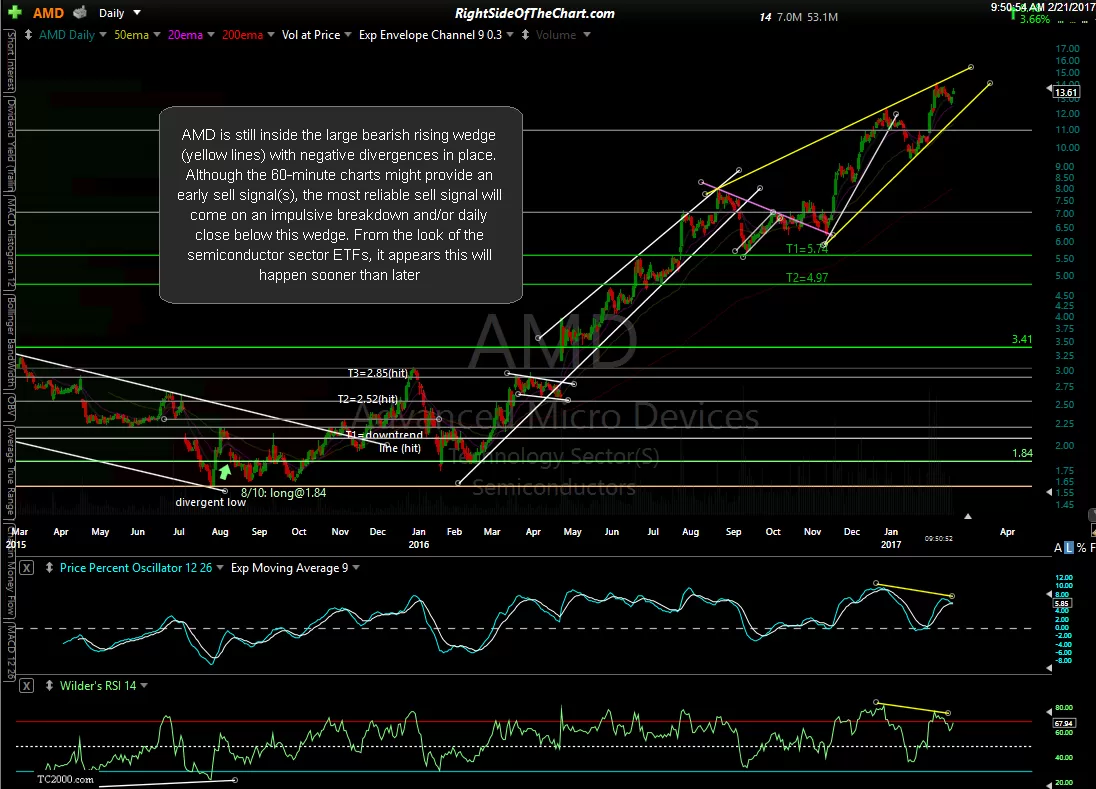
- AMD daily Feb 21st
-
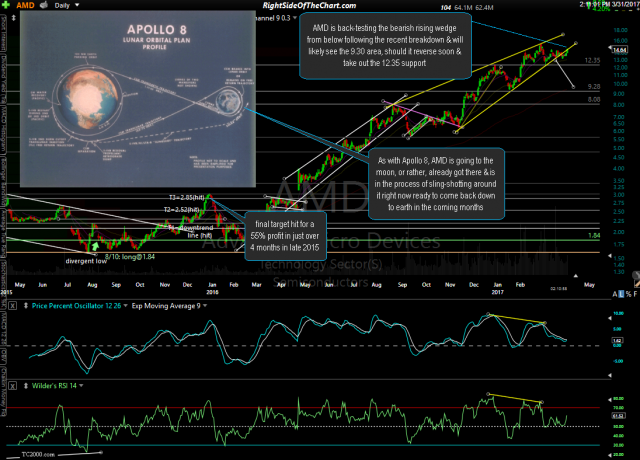
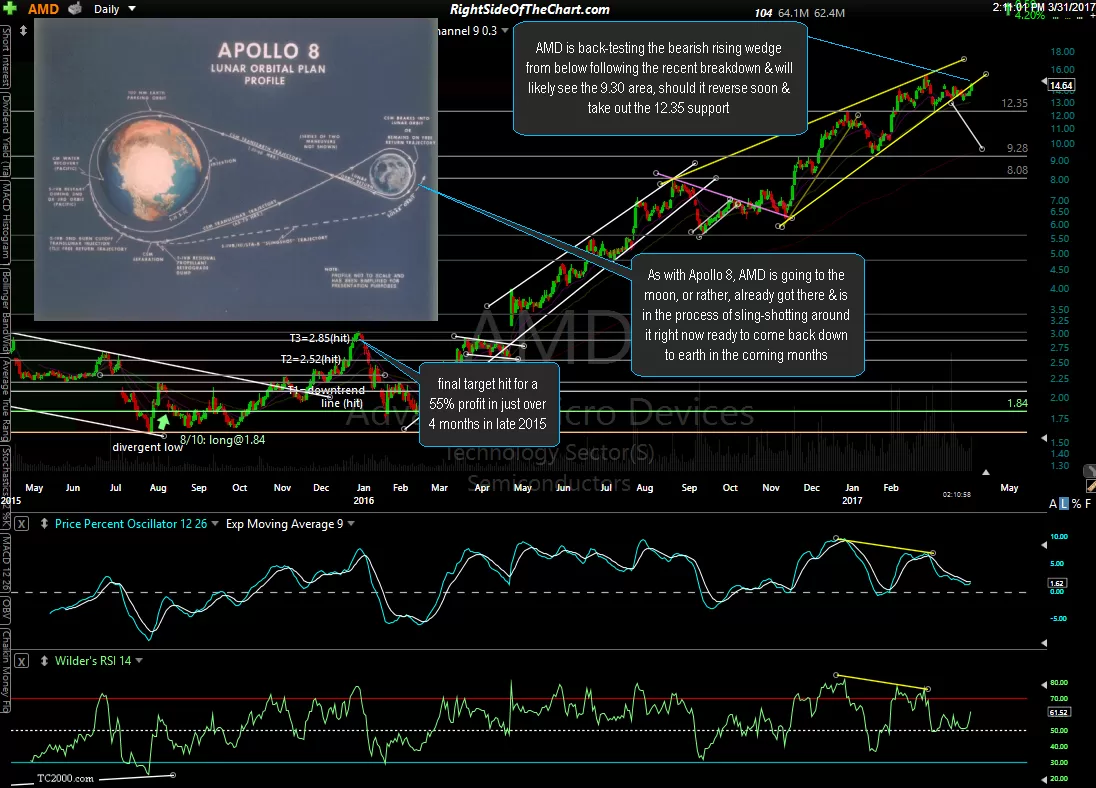
- AMD daily March 31st
-
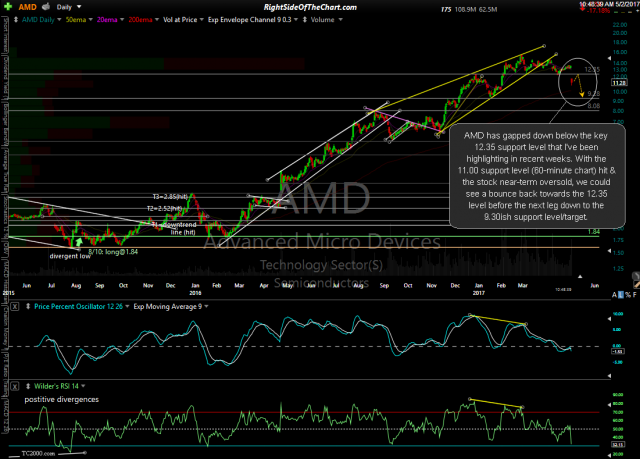
- AMD daily May 2nd
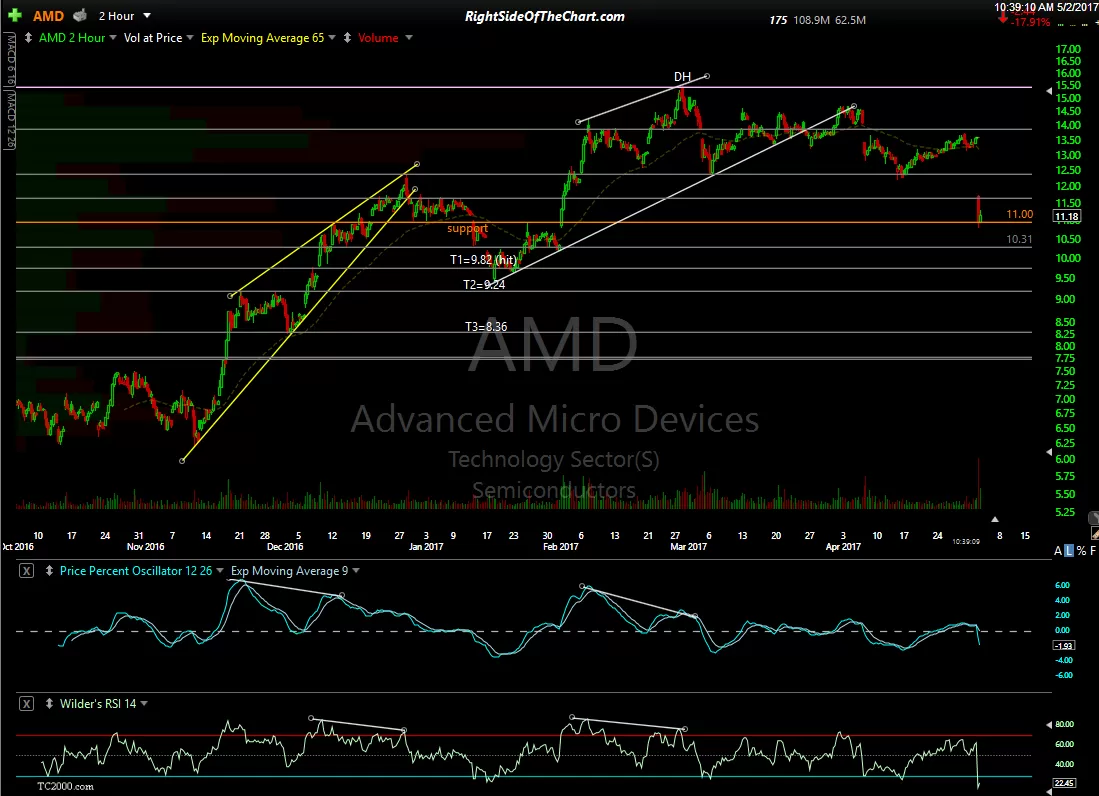
The 30% drop (so far) goes to show what happens to an over-loved, crowded one-sided trade, especially when the charts are flashing clear warning signs via the bearish rising wedge pattern & negative divergences… the same divergences that will most likely play out sooner than later in the broad market as well as the leading FAAMG stocks. Zooming down to the 60-minute time frame, it appears that my scenario from back on March 21st played out exactly as predicted it would if AMD were to take out the minor downtrend line that was highlighted at the time. Not only did AMD go on to make a divergence high, followed by a correction as was outlined but the stock reversed right around the 15.50 level where it was predicted. The charts below are the 60-minute from March 21st followed by the updated 120-minute & 60-minute charts.
-
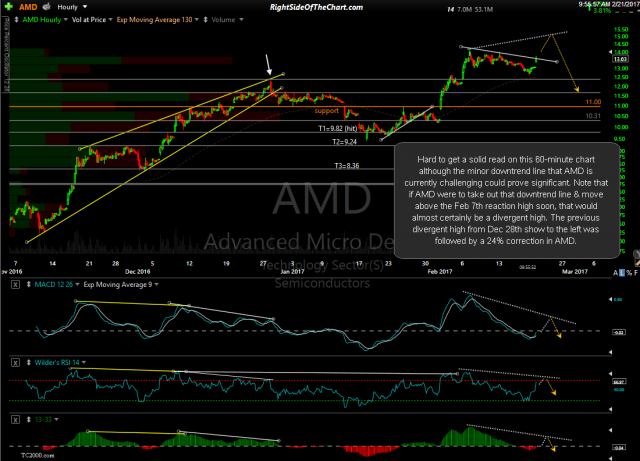
- AMD 60-min Feb 21st

-
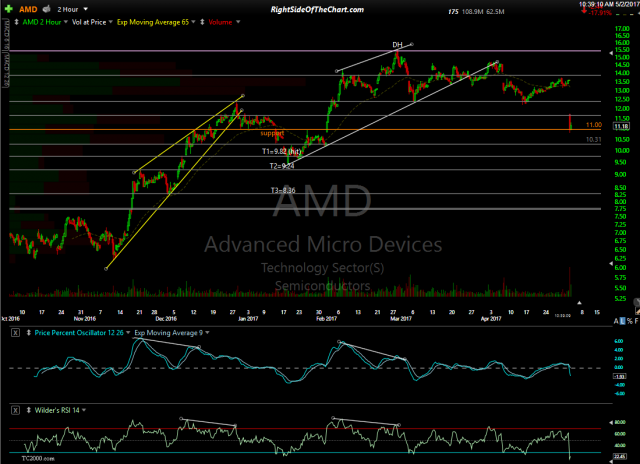
- AMD 120-min May 2nd
-

- AMD 60-minute May 2nd
AMD is not an official short trade at this time as I was waiting for a convincing break below the 12.35 support level before adding it as such. However, today’s gap down was too large to offer an objective entry although I will continue to post updates as I several members are currently short the stock & I have been beating the bearish drums on this one for a while. Should AMD rally back towards the 12.35 area, which is now resistance, that would most certainly be an objective entry although this stock had (and still has) a lot of hot air to let out so I wouldn’t be surprised if the stock continues down towards the 9.30 area without any rally anywhere close to the 12.35 level before then.