
As the world’s second-largest publicly traded company & one of the top components of both the S&P 500 & Nasdaq 100, AMZN (Amazon Inc.) is likely to be one of the primary drivers of the next correction in the US stock market if & when the stock makes a convincing break below this key, nearly year-long uptrend line.
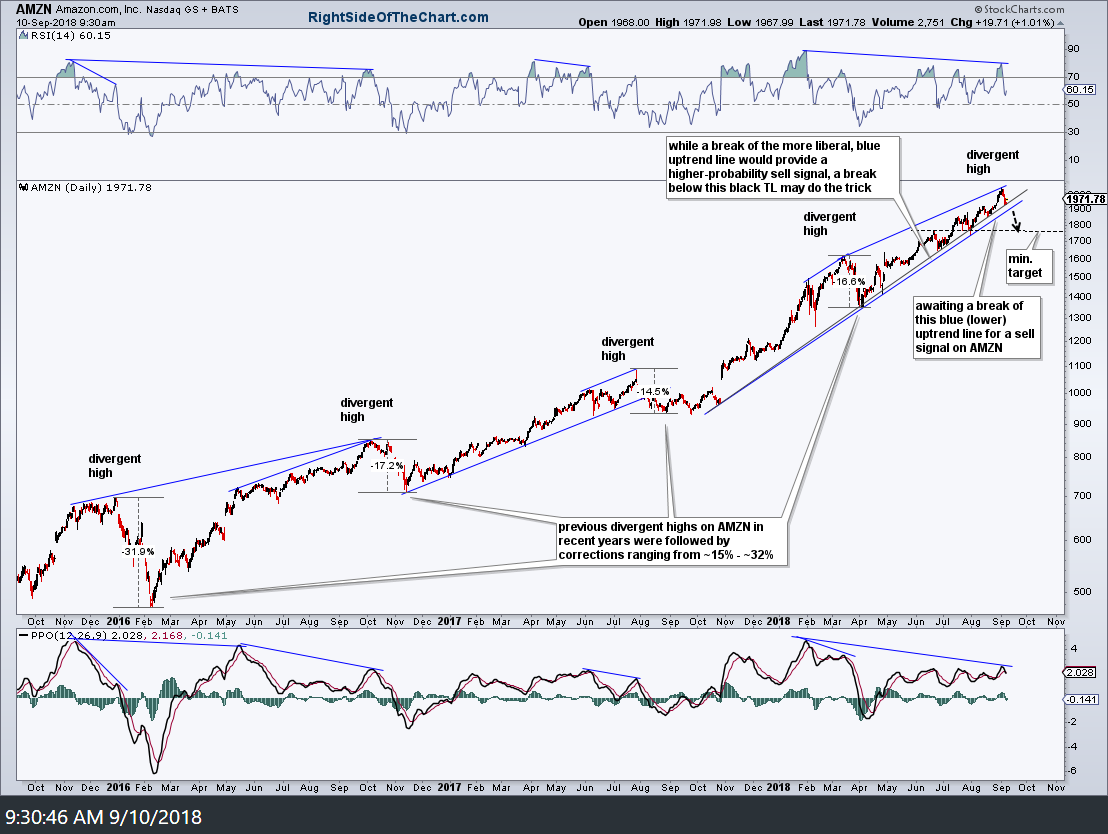
AMZN daily Sept 10th
As this 3-year daily chart highlights, Amazon currently has large negative divergences which were recently ‘confirmed’ via the bearish crossover on the PPO last week, with the previous divergent highs in recent years followed by corrections ranging from roughly 15% – 32%.
The lower, blue trend line is what I call the BOD, or benefit of the doubt, trendline which comes in slightly below the black trendline which also has a good fit with many of the candlestick bodies & wicks since the October 2017 reaction low.
When I can draw two trendlines in very close proximity on a security, I prefer to wait for the second of the two to be taken out before providing a buy or sell signal as jumping the gun on a break of the first trendline has an increased risk of proving to be a whipsaw signal.
A live version of the chart above (which will refresh when the link is opened) can be viewed by clicking here. Those with a stockcharts.com account can also save this chart while non-stockcharts.com members should still be able to view the updated chart by clicking that link.
Amazon may or may not be added as an official short trade but as of now, my minimum downside target, assuming a sell signal on a solid trendline break & daily close below occurs within the coming weeks, would be the 1770ish level, roughly 10% below where the stock is currently trading.
On a final note, as I often say, divergences are not a buy or sell signal, merely an indication that an impending trend change is likely. Buy & sell signals, following a divergent low or high, come on some type of catalyst such as a trendline break, breakout above/below price support, candlestick reversal patterns, etc.