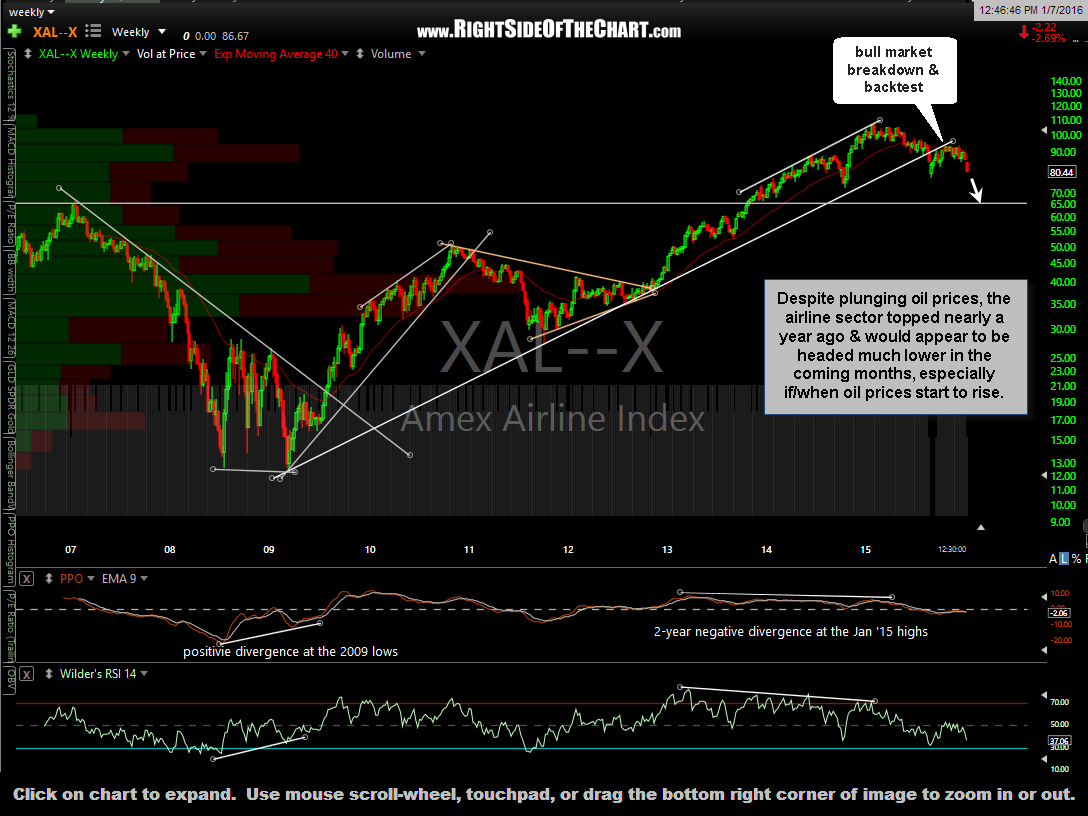
Despite plunging oil prices, the airline sector topped nearly a year ago & would appear to be headed much lower in the coming months, especially if/when oil prices start to rise. This 10-year weekly chart of the $XAL (Amex Airline Index) shows that after a monstrous 757% gain (coincidental, as the 757 was one of the most popular commercial airlines every produced… I calculated that gain off the March ’09 lows to the Jan ’15 high), the $XAL went on to break down below its bull market uptrend line in August, backtesting the trendline from below a couple of months later & has clearly rolled back over since. The long-standing negative divergences leading up to the 2015 highs help to confirm the bearish breakdown & the fact that the bear market in the airline sector will most likely continue well into 2016.
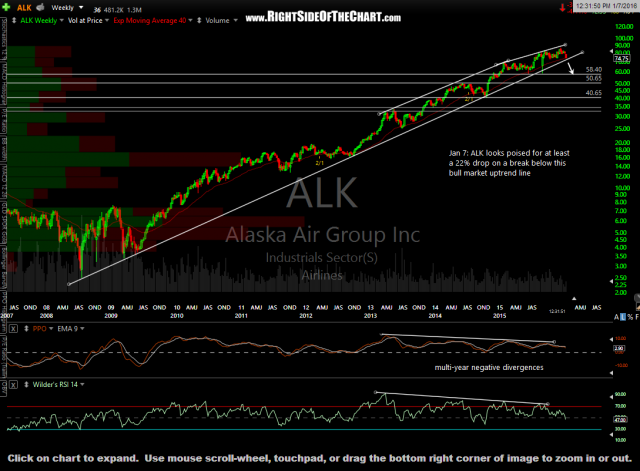
One of several airline stocks on my radar is ALK (Alaska Air Group, Inc.). ALK looks poised for a likely decent to at least the 61.50 level & quite possibly as low as the 42 area before all is said & done. ALK will tirgger a short entry on a break blow 74.20 with a suggested stop based on a 3:1 or better R/R to one’s preferred price target(s). The prices targets for this trade are T1 a 70.88, T2 at 61.80, T3 at 50.80 & T4 at 42.30. note- since I began annotating these charts & composing this post, ALK went on to trade below 74.20 & as such, will be posted directly as an Active Trade at the current price of 73.90.
- ALK weekly Jan 7th
- ALK daily Jan 7th


