
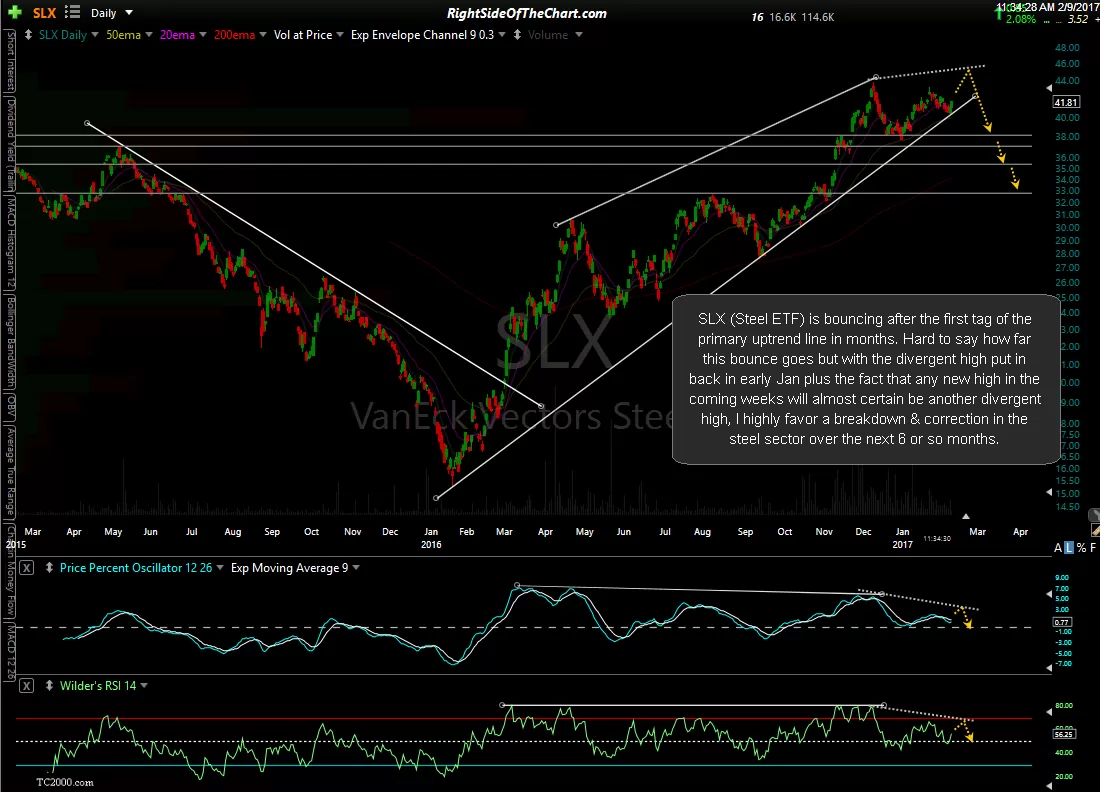
Member @murphydoc inquired within the trading room if AKS (AK Steel Holding Corp) & the steel sector might have bottomed along with AKS’s earnings induced rally today. My opinion on the next major trend in the steel sector isn’t as strong as it was back in January when the I was calling for a top & correction in the steel sector in this post/video along with reiterating that call, even forecasting one last thrust to new highs before the top would be in this follow-up post back in early February. That SLX chart/scenario from February 9th is followed by the updated SLX chart & $STEEL (ACRA Steel Index) daily charts below, highlighting how that scenario played out as predicted, even with the expected reactions at or very near each target/support level so far.
-
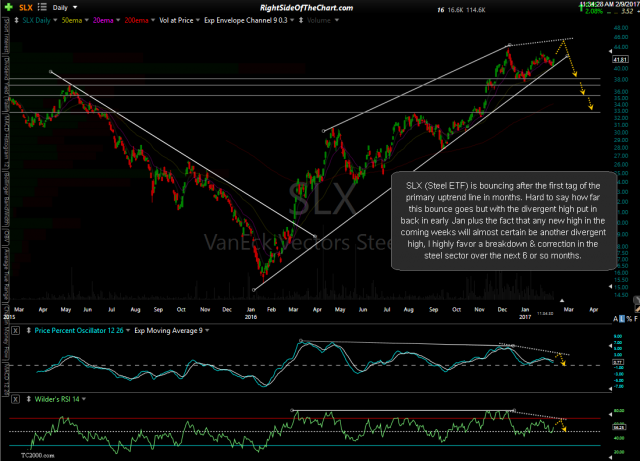
- SLX daily Feb 9th
-
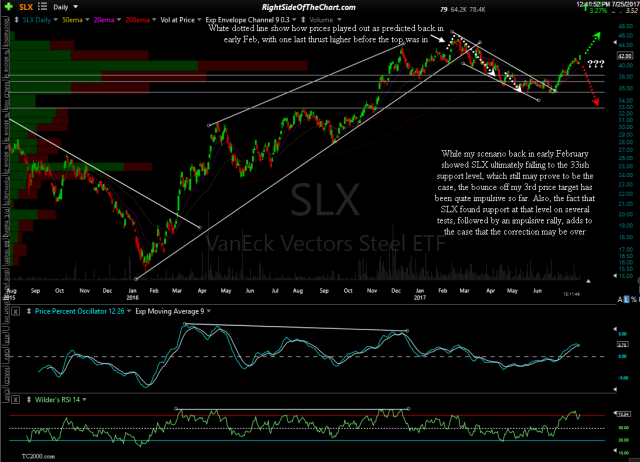
- SLX daily July 25th

-
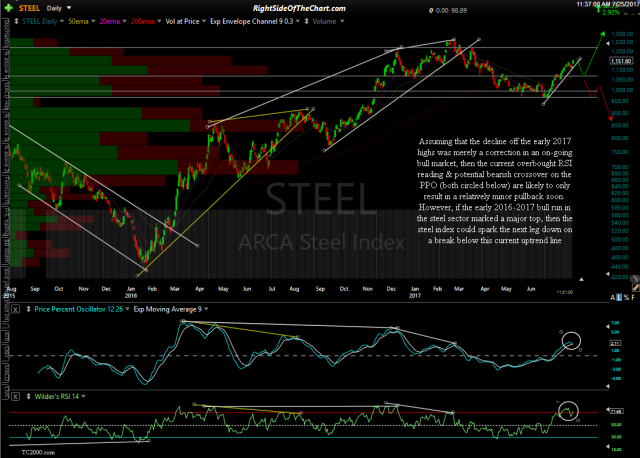
- $STEEL daily July 25th
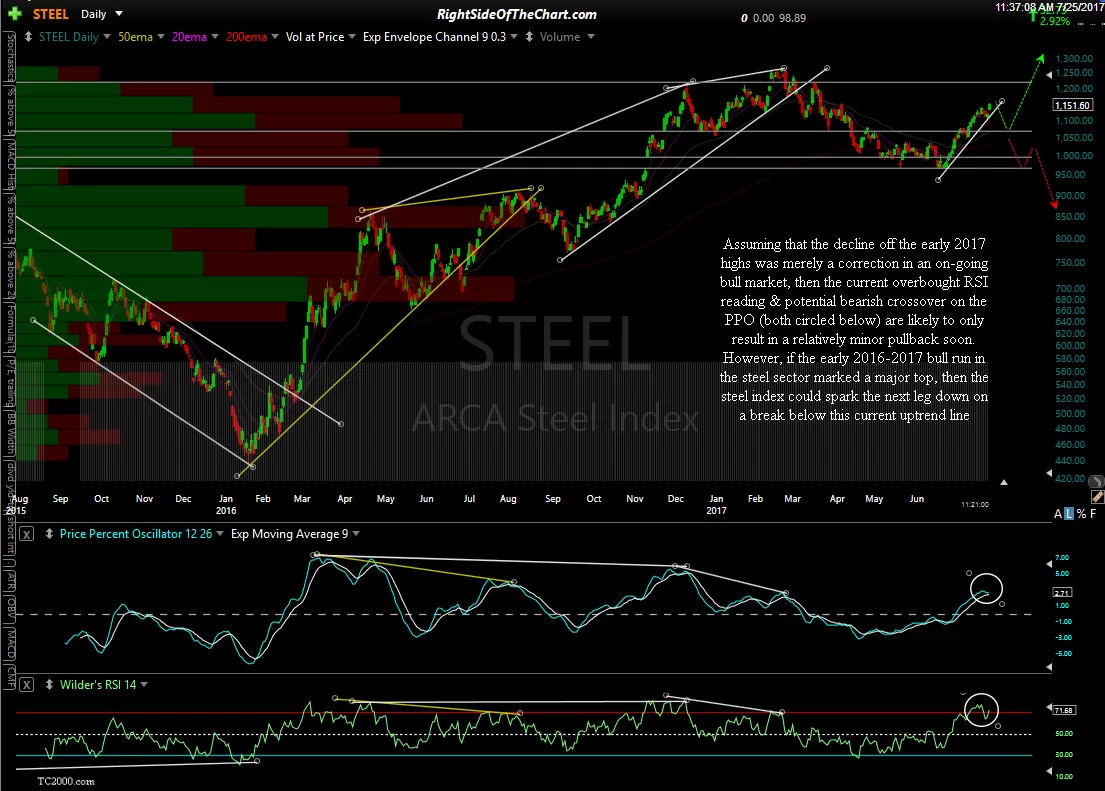
While my conviction on the next major trend in the steel stocks is not as strong as it was back then, there are some interesting developments on the charts worth highlighting on the ARCA Steel Sector daily chart above. Assuming that the decline off the early 2017 highs was merely a correction in an ongoing bull market, then the current overbought RSI reading & potential bearish crossover on the PPO (both circled below) are likely to only result in a relatively minor pullback soon. However, if the early 2016-2017 bull run in the steel sector marked a major top, then the steel index could spark the next leg down on a break below this current uptrend line. Overbought readings during primary uptrends often become “more overbought” and/or stay overbought for extended periods of time while overbought readings during primary downtrends (i.e.- bear markets) are often fleeting, soon followed by a resumption of the downtrend.
AKS recently broke out above & successfully backtested the descending price channel following a divergent low (bullish). If that divergent low back in May marked the end of the correction off the early 2017 highs, then AKS will likely continue higher in the coming months, going on to hit any or all of the overhead targets that are labeled. The most objective long entry would be a convincing break above the top of the resistance zone overhead (7.00 level) with the 5.90 area as support below. Note how the PPO signal line (PPO 9-ema) has done a nice job of defining the intermediate-term trends in AKS in the past; bullish when the PPO signal line is trading above the zero line, bearish when below. As of now, that trend indicator is bullish & will remain so as long as the PPO signal line remains above zero.

AKS daily July 25th