 fyi- i did a comprehensive overview/update of the major global indices which is almost finished uploading and should be posted soon.
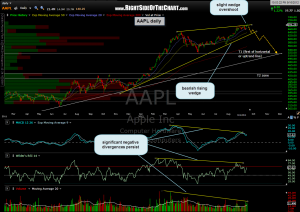
i’ve also started to update some of the existing short trades starting with the big dog, AAPL. as far as an exit plan if the short trade does not work out, i would consider a stop around the 720 level. typically, i place my stops on short trades just north of a resistance level that most closely lines up with the dollar or percentage loss that i am willing to accept on the trade, based on the R/R and other factors. however, when shorting stocks at or near all-time highs, like AAPL, there isn’t any resistance overhead to use for stop. therefore, i have modified (and estimated) the first price target to come up with an expected R/R (risk vs. reward profile) on the trade.
the original first target was the daily uptrend line. as that is a moving target (impossible to know what level AAPL will hit it assuming the stock does fall), i have come up a revised first target of 520. this target is a combination of both horizontal support (as shown by the horizontal line that i added to this updated daily chart) and my best guesstimate on how long AAPL will take to get there, again assuming that the stock reverses soon.
if that first target of 520 is hit, that would be a 160 point gain from the entry price of 680. therefore, using a R/R of 4:1, that would allow for a 40 point loss on the short if the stop was placed at 720 (40 points above entry). current, as hot as the market has been lately, the AAPL short is only down 1.6% from entry. like most of the US indices, AAPL made a overthrow of it’s bearish rising wedge pattern on friday. very often, these wedge overthrows are followed up by a sharp reversal in the opposite direction shortly afterwards. nothing is 100% in trading but something to watch for.

