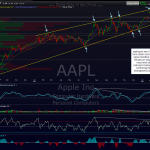
as a follow-up post to this recent chart showing AAPL’s history of usually rallying for a few days to a week or so post earnings before making a pullback, here’s my updated daily chart. regarding the divergences noted below on volume, macd, macd histogram and RSI, to confirm any bearish sell signal on AAPL we would first need to 1) see AAPL get rejected off this upper wedge trendline (or very shortly thereafter on any move above it) and 2) we’d need to see the macd turn down soon and have the fast line cross below the fast line, confirming the negative divergence that potentially forming here.


