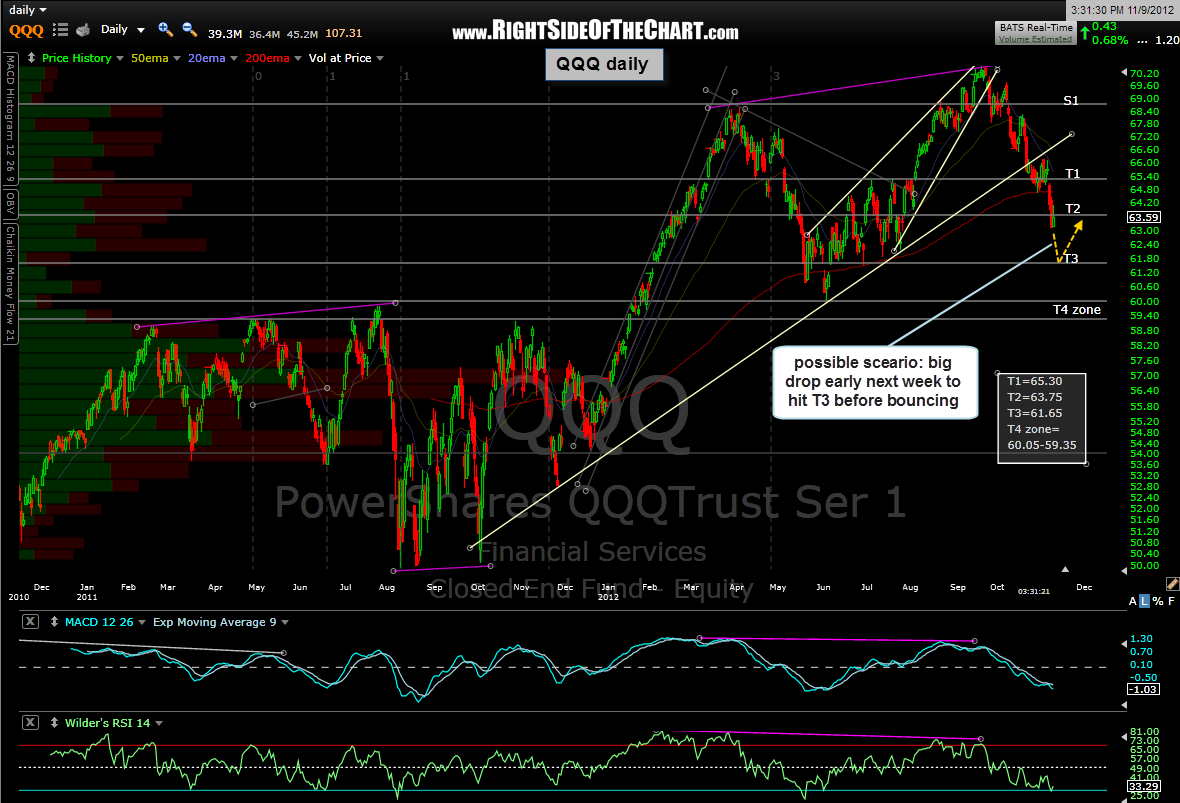
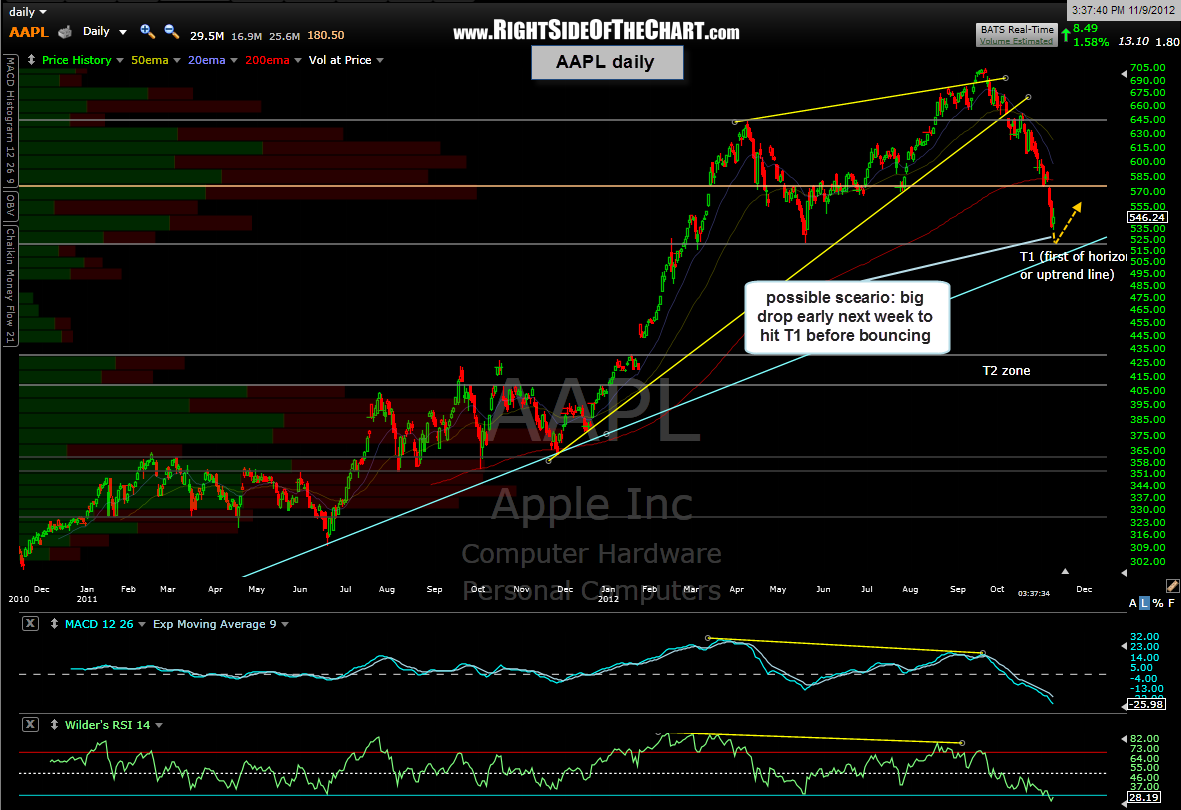
Although I see AAPL likely going higher soon to backtest that 574.75 area mentioned earlier, upon further review of the charts there is another scenario in which it does so: I could easily see AAPL, along with the broad market, gap down on Monday and drop about 2 1/2% or so, which would bring AAPL to my first target of around 522.30 as well as drawing the SPY to my first target zone (daily chart) and the QQQ to my third target (daily chart and/or 4 hour chart). In fact, although it’s almost a coin-toss decision between this and my earlier scenario (AAPL bouncing to the 574.75 before turning lower and reaching T1), I am leaning more towards this updated scenario and as such, have just closed out 1/2 my longs (for a very modest gain) and will likely sell the other half before the close.
However, be advised that we can easily bounce next early week also as the 60 minute charts index covered in the video last night and today did indeed manage to hold the line where they needed to in order to keep those bullish divergences intact (not to mention the SPY bouncing off the bottom of it’s channel & the QQQ completing the throwback into it’s channel). The updated daily charts on AAPL, QQQ, & SPY below illustrate how this might play out. Best to keep things light/hedge going into the weekend if you are unsure of what to do.