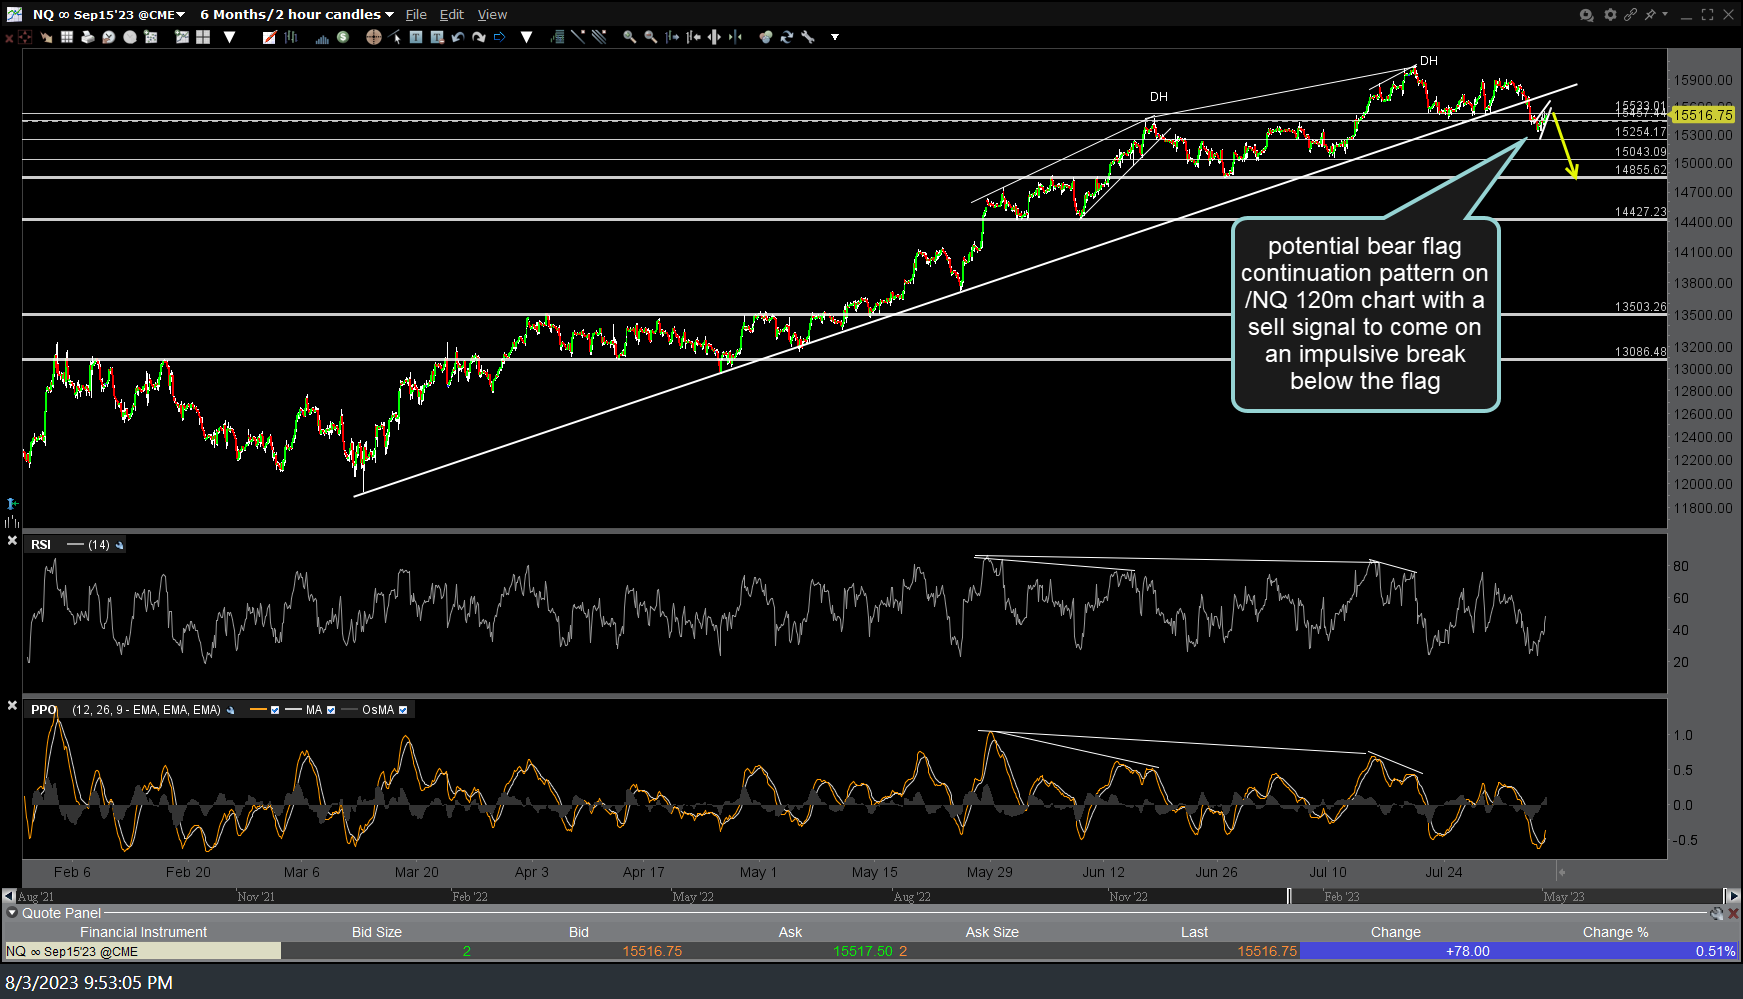
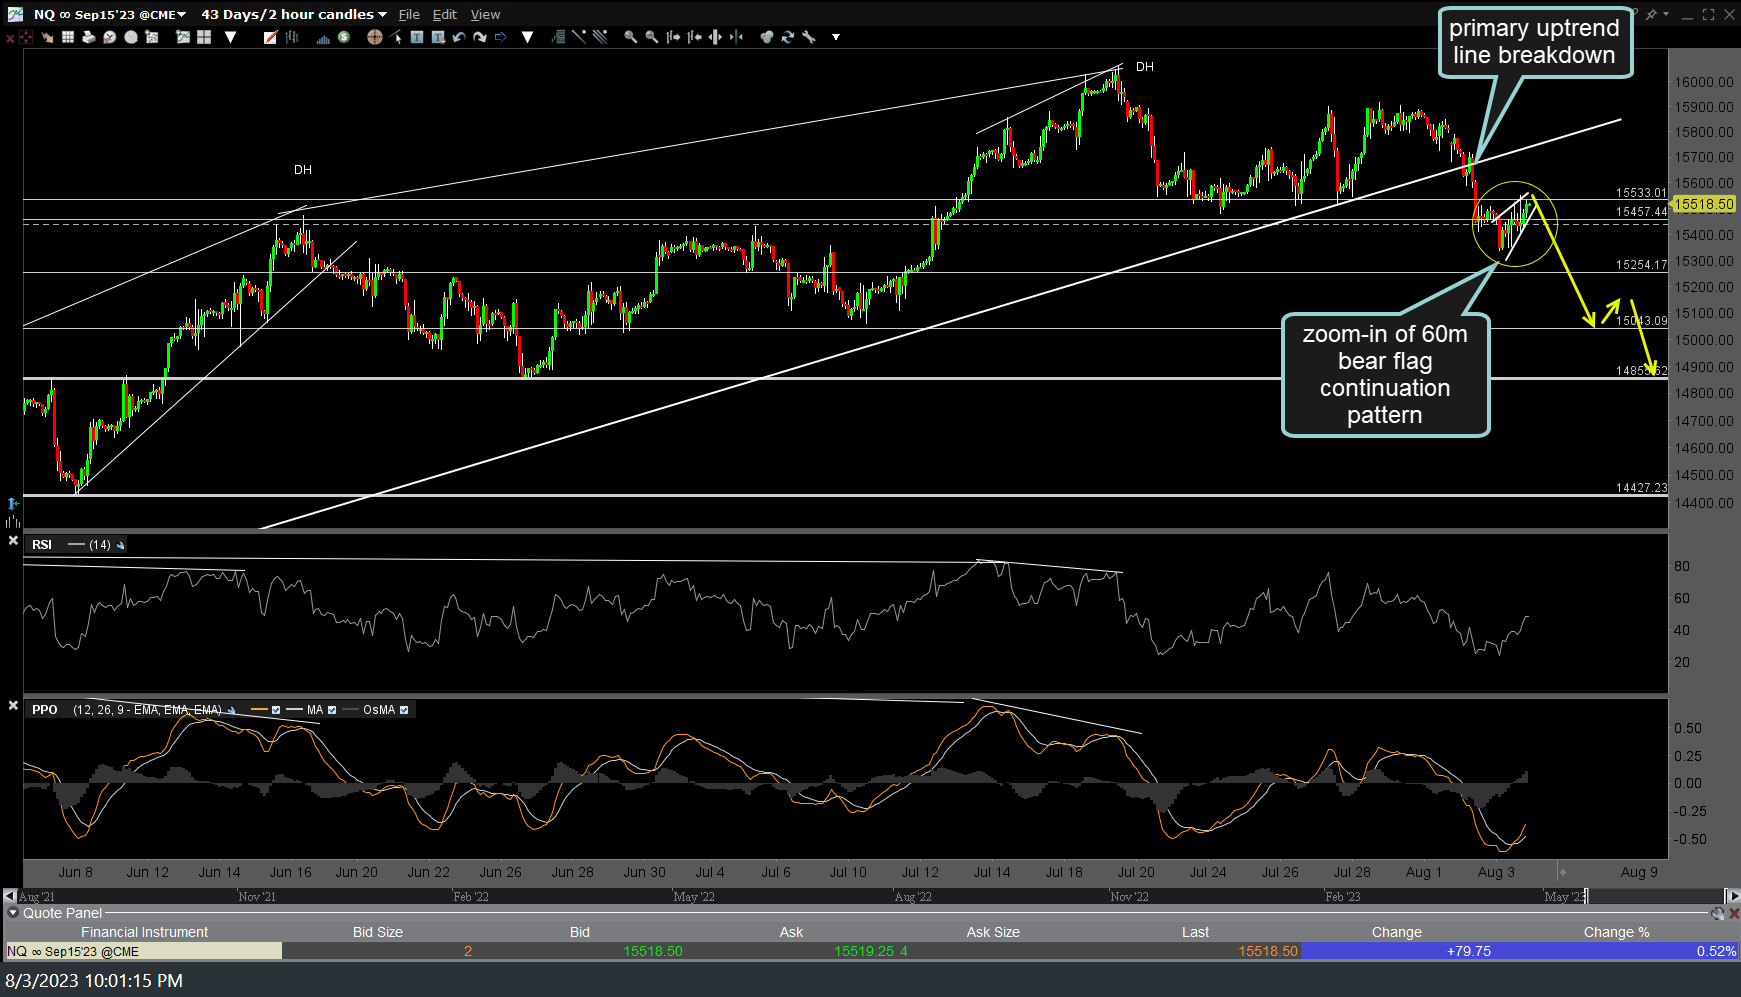
The 120-minute chart below shows a potential bear flag continuation pattern on /NQ (Nasdaq 100 futures) with a sell signal to come on an impulsive break below the flag with the second chart a zoomed in version to more clearly show the potential pattern (“potential” as in any bearish technical pattern is simply that, a potential bearish pattern pending a trigger/sell signal below the pattern… no breakdown, no sell signal/short entry… although to be clear, we already have a recent & more significant sell signal on the breakdown below the primary uptrend line).
Getting a bit more granular by zooming down to the 15-minute time frame, /NQ is current trading at my ‘most likely’ bounce target zone of roughly 15517-15500) with a current max. bounce target of this downtrend line off the mid-July highs (about 1.7% above current levels).
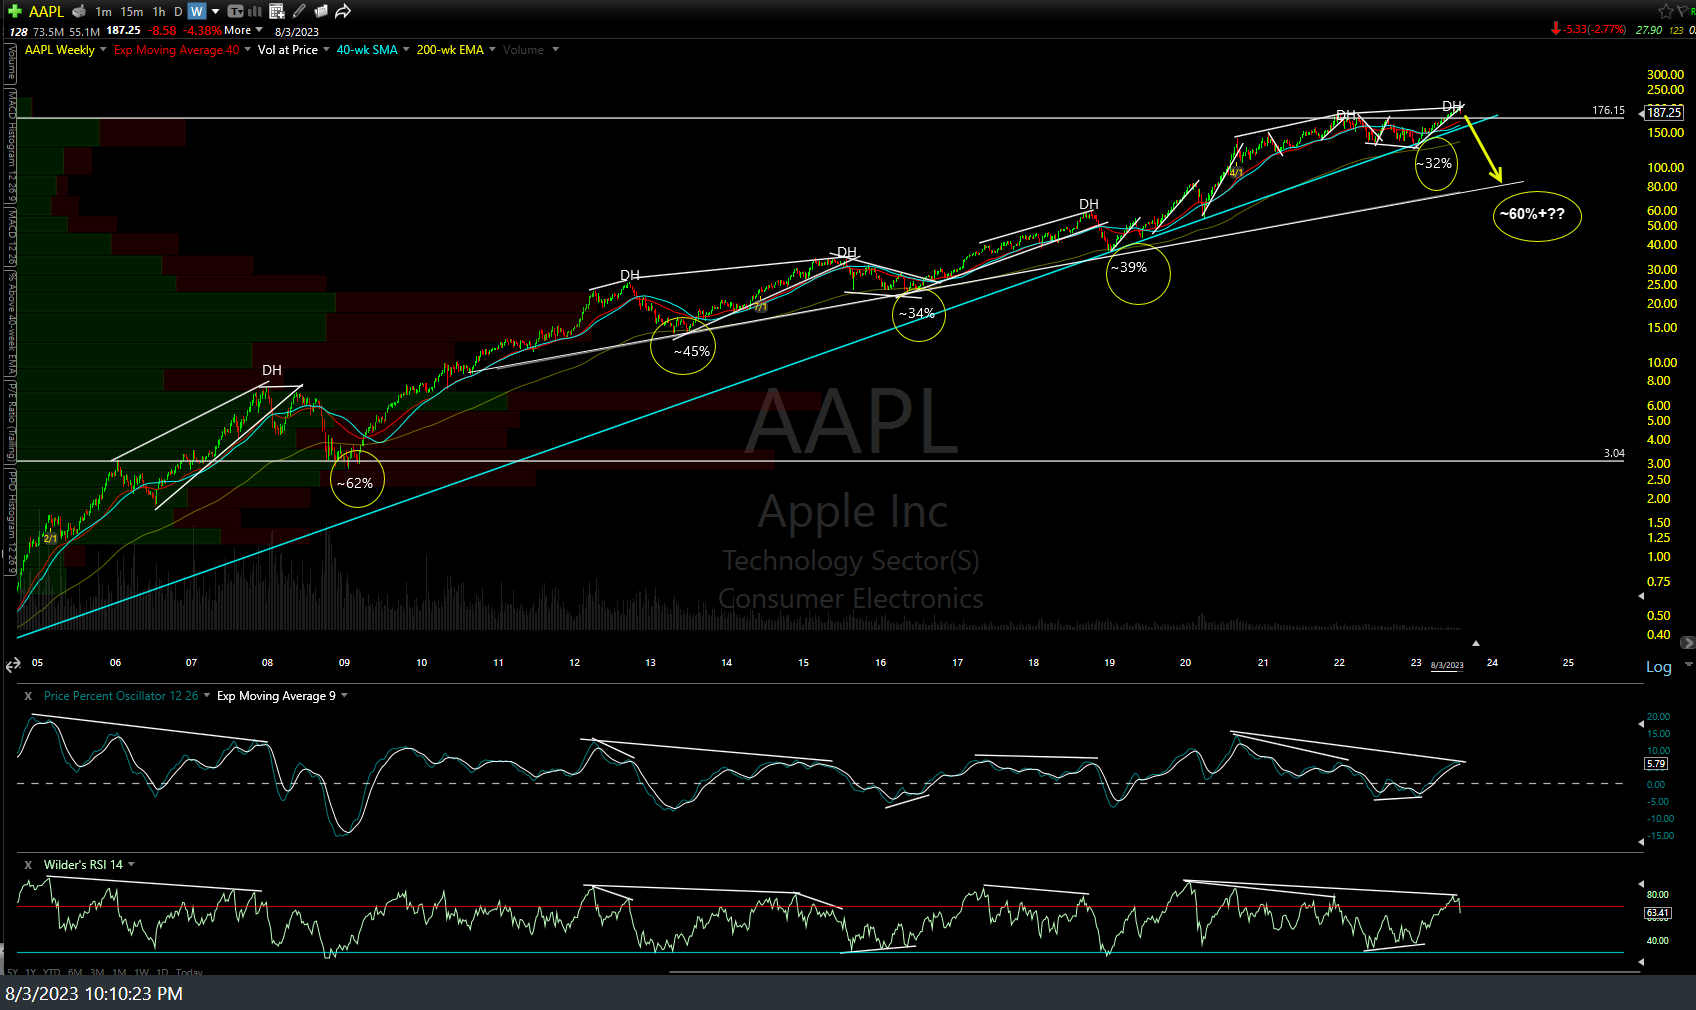
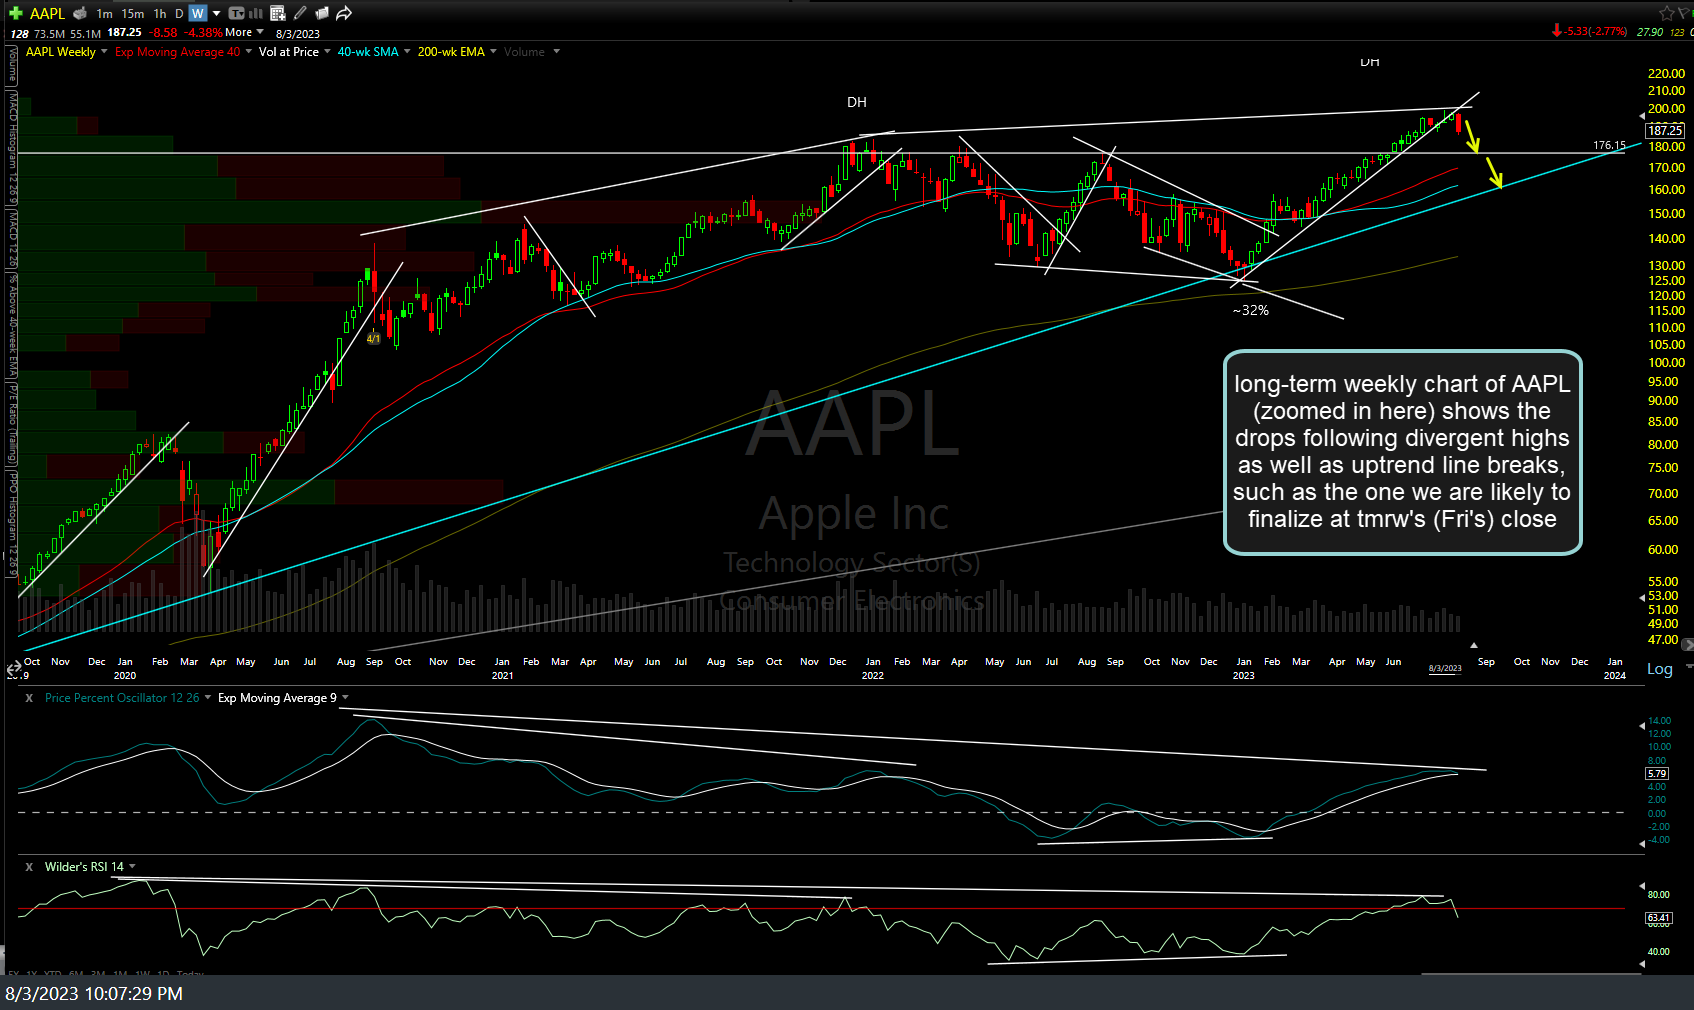
This long-term weekly chart of AAPL (Apple Inc.), which includes tonight’s AH session trades, shows the drops following divergent highs as well as uptrend line breaks, such as the one we are likely to finalize at tomorrow’s (Friday’s) close, barring a substantial reversal & rally into the close tomorrow. The second chart is a zoomed in version showing how solid the current weekly candle is currently trading below the uptrend line, as of the close of tonight’s after-hours session.


